Instant Home Estimate
For your home value estimate, enter the access code you received on the postcard, just click here:
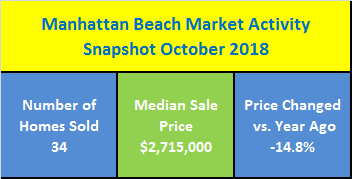
Manhattan Beach, CA Real Estate sales have seen a higher number of homes that closed in October 2018 than in October 2017. While the listing price for October 2018 was lower as compared to a year ago, monthly price of homes for sale was up from previous month amid continued low inventory levels. The sold price of homes that closed was higher for the month.
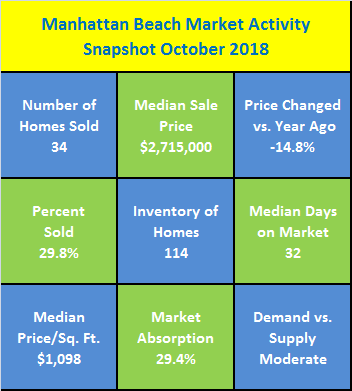
For October 2018, a total of 114 homes in Manhattan Beach, CA were for sale. The number of Homes for Sale that sold was 34 in October 2018 vs. 24 in September 2018 and 26 that sold in October 2017. Of the 34 homes under contract to close during the month of October 2018, the median time marketed for sale was 32 days. Compared to September 2018, the median time on market was 17 days. In relation to the homes for sale that were competitively priced in Manhattan Beach, the homes that sold over the prior 6-months were selling within a range of 11 to 35 median number of days (i.e., the time-period a home is marketed until the time it goes into escrow for the closing).
Here are some current charts on housing activities in the area:
| Homes for Sale | Homes Sold |
|---|---|
| Sales Price of Homes | Days on Market |
|---|---|
The 34 homes sold that actually closed represented 29.8 percent of 114 available homes for sale in Manhattan Beach, CA during October 2018. The sold price for Manhattan Beach, CA homes has retracted over the prior 6-months period. In comparison, recent sold price was down by 14.8 percent versus a year ago. And, this month’s median sold price for these homes that sold has gained 18.7 percent in October 2018 compared to September 2018. The month’s medan price-per-square-foot for homes that sold has gained 8.6 percent from September 2018, and for the 12-month period it gained 11.9 percent from October 2017 continuing a positive annual trend going forward.
Homes in October were selling slower than the month earlier. Based on recent rolling 3-month home sales activity, the months-supply index (MSI) of 3.4 suggests that it would take 3.4 months to deplete all remaining inventory of homes on the market if no additional homes was added to the market supply for sale. This shows moderate market absorption of housing inventory of Manhattan Beach, CA homes for sale. At this MSI level, it translates to a market absorption rate of 29.4 percent and demonstrates moderate level of buyer demand.
Here are current charts on Price/SqFt and Supply of homes in the area:
| Price Per Square Foot | Inventory Months Supply |
|---|---|
Typically, homes are listed for sale on the market over a period of 90 – 120 days, or sometimes longer. Over the last 4-months period, the number of homes that did not sell was 23 in Manhattan Beach. There are different reasons why some homes do not sell in any market condition. Homes that did not sell during their listing period would become expired listings. If homeowners want to move forward with their plan, with the right approach the home sale they want is still within reach. However, before putting the home back on the market, homeowners need to take a step back and review their situation.
Want To Know How To Get A House Sold After An Expired Listing? … Find out more – Click Here!
How to benefit from recent real estate market activity – Click Here!
| About the author: The above information regarding “Manhattan Beach, CA Real Estate Market Activity Snapshot For October 2018” was contributed by Lum Hugh. Lum has over 20 years of experience in real estate acquisition, investment and management.If you’re thinking of selling, buying or investing in real estate, Lum will be happy to share his knowledge and expertise as well as provide guidance for your real estate needs.
We are a real estate services company servicing the South Bay communities in Los Angeles, California. For more real estate information, just contact us. Copyright © 2016-2018 Lum Hugh | All rights reserved. |
For your home value estimate, enter the access code you received on the postcard, just click here: