Category: Housing Market Updates
Epic Housing Shortage Being Reported
Jul
06
2017

The Joint Center of Housing Studies (JCHS) at Harvard University recently released their 2017 State of the Nation’s Housing Study, and a recent blog from JCHS revealed some of the more surprising aspects of the study.
The first two revelations centered around the shortage of housing inventory currently available in both existing homes and new construction.
Regarding Existing Home Inventory:
“For the fourth year in a row, the inventory of homes for sale across the US not only failed to recover, but dropped yet again. At the end of 2016 there were historically low 1.65 million homes for sale nationwide, which at the current sales rate was just 3.6 months of supply – almost half of the 6.0 months level that is considered a balanced market.”
Regarding New Home Inventory:
“Markets nationwide are still feeling the effects of the deep and extended decline in housing construction. Over the past 10 years, just 9 million new housing units were completed and added to the housing stock. This was the lowest 10-year period on records dating back to the 1970s, and far below the 14 and 15 million units averaged over the 1980s and 1990s.”
Bottom Line
The biggest challenge in today’s market is getting current homeowners and builders to realize the opportunity they have to maximize profit by selling and/or building NOW!!
Posted in For Sellers, Housing Market Updates, New Construction
NAR Data Shows Now Is a Great Time to Sell!
Jul
03
2017

We all realize that the best time to sell anything is when demand is high and the supply of that item is limited. Two major reports issued by the National Association of Realtors (NAR) revealed information that suggests that now continues to be a great time to sell your house.
Let’s look at the data covered in the latest REALTORS® Confidence Index and Existing Home Sales Report.
REALTORS® CONFIDENCE INDEX
Every month, NAR surveys “over 50,000 real estate practitioners about their expectations for home sales, prices and market conditions.” This month, the index showed (again) that home-buying demand continued to outpace supply in May.
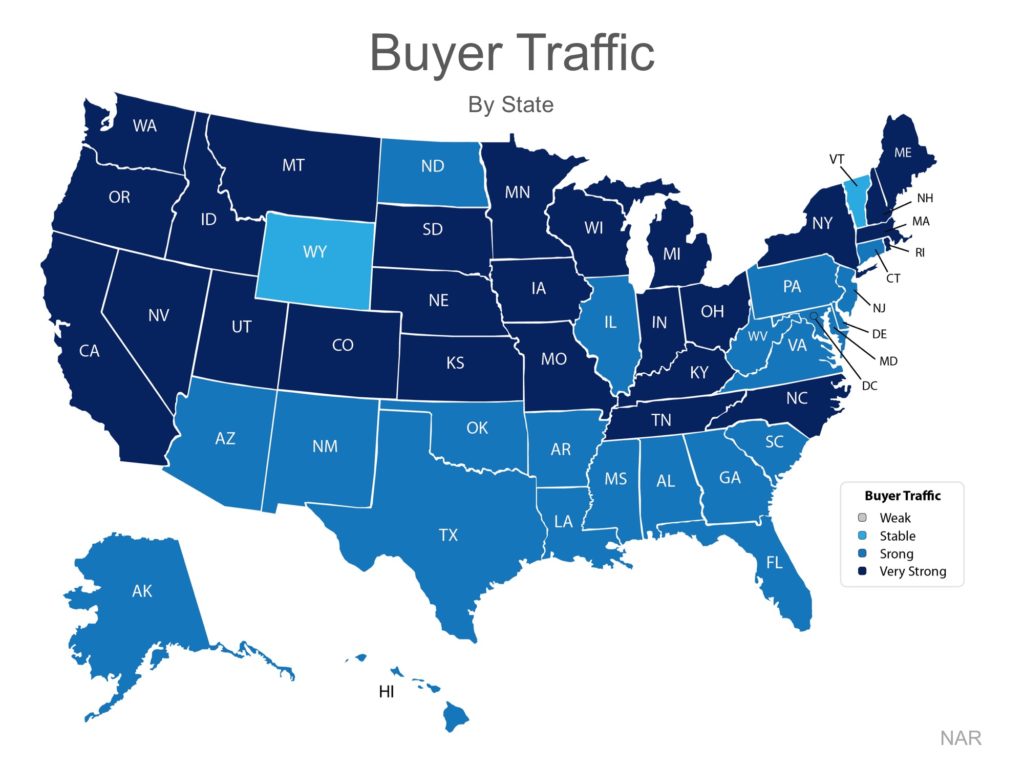
The map below illustrates buyer demand broken down by state (the darker your state, the stronger the demand is there).
In addition to revealing high demand, the index also mentioned that “compared to conditions in the same month last year, seller traffic conditions were ‘weak’ in 24 states, ‘stable’ in 25 states, and ‘strong’ in D.C and West Virginia.”
Takeaway: Demand for housing continues to be strong throughout 2017, but supply is struggling to keep up, and this trend is likely to continue into 2018.
THE EXISTING HOME SALES REPORT
The most important data revealed in the report was not sales, but was instead the inventory of homes for sale (supply). The report explained:
- Total housing inventory rose 2.1% to 1.96 million homes available for sale
- That represents a 4.2-month supply at the current sales pace
- Unsold inventory is 8.4% lower than a year ago, marking the 24th consecutive month with year-over-year declines
According to Lawrence Yun, Chief Economist at NAR:
“Current demand levels indicate sales should be stronger, but it’s clear some would-be buyers are having to delay or postpone their home search because low supply is leading to worsening affordability conditions.”
In real estate, there is a guideline that often applies; when there is less than a 6-month supply of inventory available, we are in a seller’s market and we will see appreciation. Between 6-7 months is a neutral market, where prices will increase at the rate of inflation. More than a 7-month supply means we are in a buyer’s market and should expect depreciation in home values.
As we mentioned before, there is currently a 4.2- month supply, and houses are going under contract fast. The Confidence Index shows that 55% of properties were on the market for less than a month when sold.
In May, properties sold nationally were typically on the market for 27 days. As Yun notes, this will continue, unless more listings come to the market.
“With new and existing supply failing to catch up with demand, several markets this summer will continue to see homes going under contract at this remarkably fast pace of under a month.”
Takeaway: Inventory of homes for sale is still well below the 6-month supply needed for a normal market. And the supply will continue to ‘fail to catch up with demand’ if a ‘sizable’ supply does not enter the market.
Bottom Line
If you are going to sell, now may be the time to take advantage of the ready, willing, and able buyers that are still out searching for your house.
Posted in For Sellers, Housing Market Updates
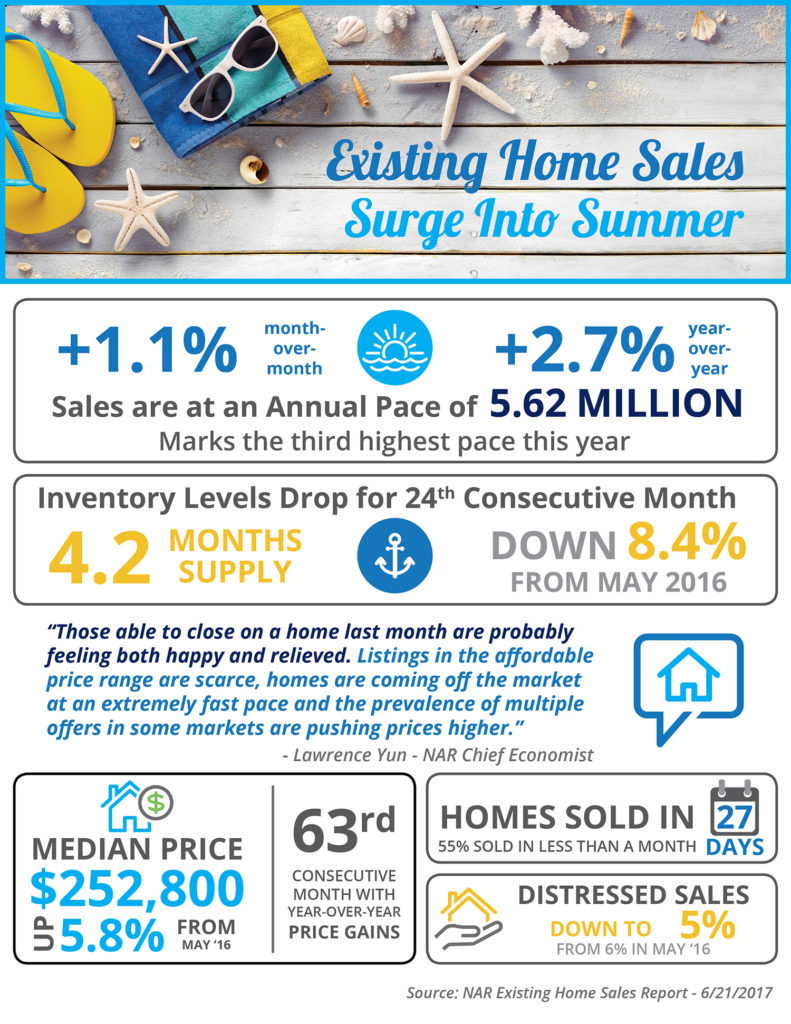
Existing Home Sales Surge into Summer [INFOGRAPHIC]
Jun
30
2017

Some Highlights:
- Existing Home Sales reached their third highest mark this year in May.
- Inventory of homes for sale has dropped 8.4% since last year, marking the 24th consecutive month of year-over-year declines.
- NAR’s Chief Economist, Lawrence Yun had this to say: “Those able to close on a home last month are probably feeling both happy and relieved. Listings in the affordable price range are scarce, homes are coming off the market at an extremely fast pace and the prevalence of multiple offers in some markets are pushing prices higher.”
Posted in For Buyers, For Sellers, Housing Market Updates, Infographics
The Supply & Demand Problem Plaguing New Construction
Jun
21
2017
Many real estate economists have called on new home builders to ramp up production to help relieve the shortage of inventory of homes for sale throughout the United States. The added inventory would no doubt aid buyers in their search to secure their dream home, while also helping to ease price increases throughout the country.
Unfortunately for builders, there are many forces that are making it difficult for them to do just that!
Last week at the National Association of Real Estate Editors 51st Annual Conference, CoreLogic’s Chief Economist Frank Nothaft broke down the 4 ‘L’s of New Home Construction: Lots, Labor, Lumber, and Lending.
The concept of supply and demand is ripe in the new home construction industry. The four ‘L’s of new home construction are each suffering a supply problem, and with that comes added costs. Let’s break it down!
Lots – There is a shortage of land near metros at an affordable price, causing builders to move farther and farther away from cities to keep costs down. This isn’t always an attractive option for those who want to stay close to work.
Labor – The Great Recession forced many skilled construction and trade workers to find other sources of income once their jobs were lost at the time of the crash. Even though the overall housing market has recovered, these workers have not returned. Those who remain are starting to age out and retire, causing even more of a shortage and additional costs.
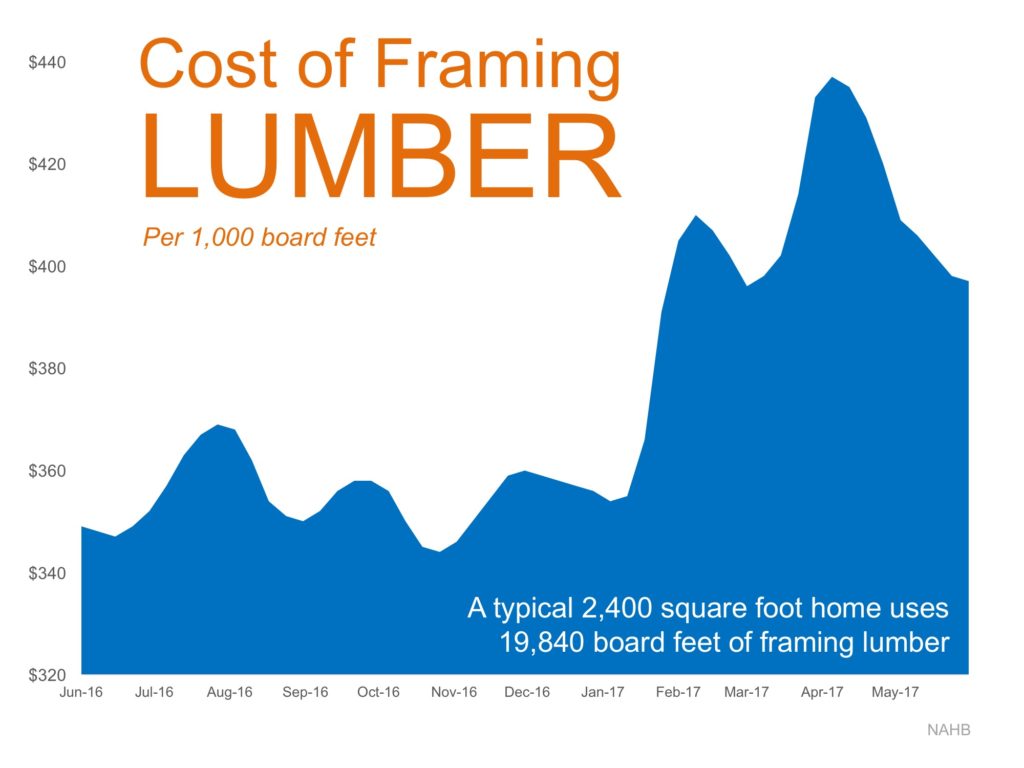
Lumber – The cost to build a new home is directly tied to the cost of the lot and the cost of the supplies needed to build the home. Lumber costs continue to escalate due to policies restricting the importation of Canadian lumber, making larger luxury homes an attractive option to recoup costs when selling, rather than building smaller single-family homes and making less profit.
Below is a graph showing the increase in cost of 1,000 board feet of framing lumber.
Year-over-year, lumber costs are up 13% after reaching a high of $433 in the second week of April.
Lending – During the Great Recession, many small community banks were forced to close their doors. These banks were a great source of capital and lending for builders looking to borrow money at a low interest rate in the community in which they were building. Tougher lending standards have made borrowing funds more expensive and more difficult for builders.
Bottom Line
Additional costs across all 4 ‘L’s have made building luxury properties more attractive to builders as they are able to make a larger margin with the higher sales price. The move to scale down to starter and trade up homes to help with supply will mean any additional costs are absorbed by the builders unless the supply of the 4 ‘L’s can increase!
Posted in Housing Market Updates, New Construction
Buying Is Now 33.1% Cheaper Than Renting in the US
Jun
19
2017

The results of the latest Rent vs. Buy Report from Trulia show that homeownership remains cheaper than renting with a traditional 30-year fixed rate mortgage in the 100 largest metro areas in the United States.
The updated numbers actually show that the range is an average of 3.5% less expensive in San Jose (CA), all the way up to 50.1% less expensive in Baton Rouge (LA), and 33.1% nationwide!
Other interesting findings in the report include:
- Interest rates have remained low and, even though home prices have appreciated around the country, they haven’t greatly outpaced rental appreciation.
- With rents & home values moving in tandem, shifts in the ‘rent vs. buy’ decision are largely driven by changes in mortgage interest rates.
- Nationally, rates would have to reach 9.1%, a 128% increase over today’s average of 4.0%, for renting to be cheaper than buying. Rates haven’t been that high since January of 1995, according to Freddie Mac.
Bottom Line
Buying a home makes sense socially and financially. If you are one of the many renters out there who would like to evaluate your ability to buy this year, let’s get together to find your dream home.
Posted in First Time Home Buyers, For Buyers, Housing Market Updates
Are Home Prices Approaching Bubble Territory?
Jun
15
2017

As home values continue to rise, some are questioning whether we are approaching another housing bubble. Zillow just reported that:
“National home values have surpassed the peak hit during the housing bubble and are at their highest value in more than a decade.”
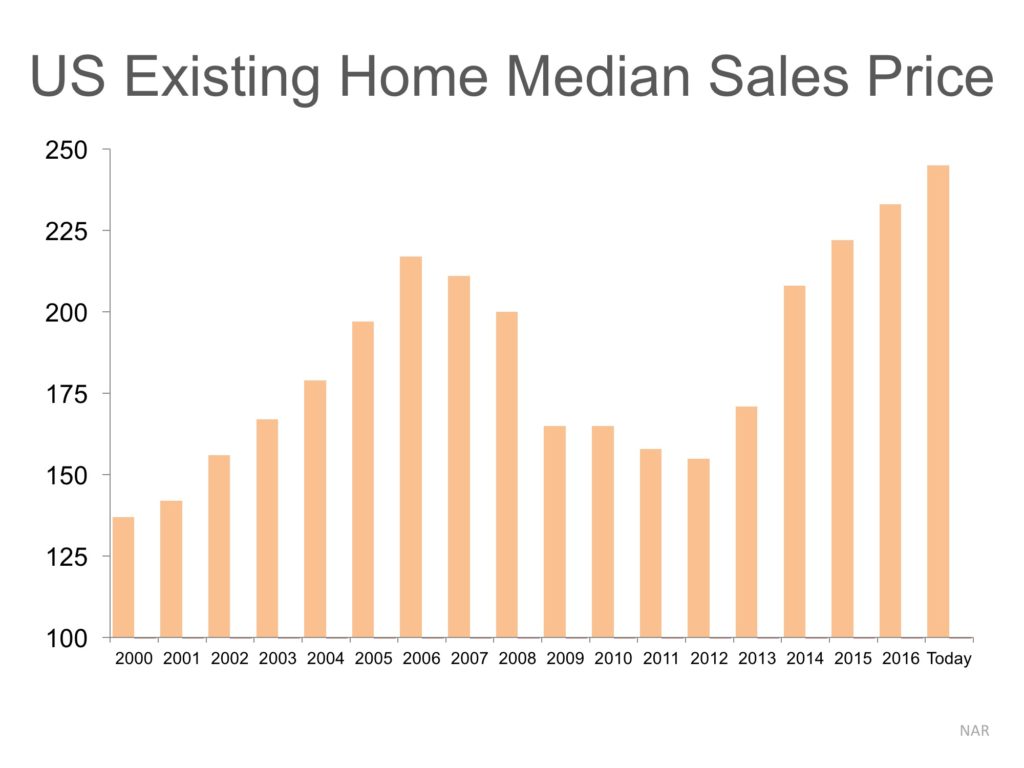
Though that statement is correct, we must realize that just catching prices of a decade ago does not mean we are at bubble numbers. Here is a graph of median prices as reported by the National Association of Realtors (NAR).
We can see that prices rose during the early 2000s, fell during the crash and have risen since 2013.
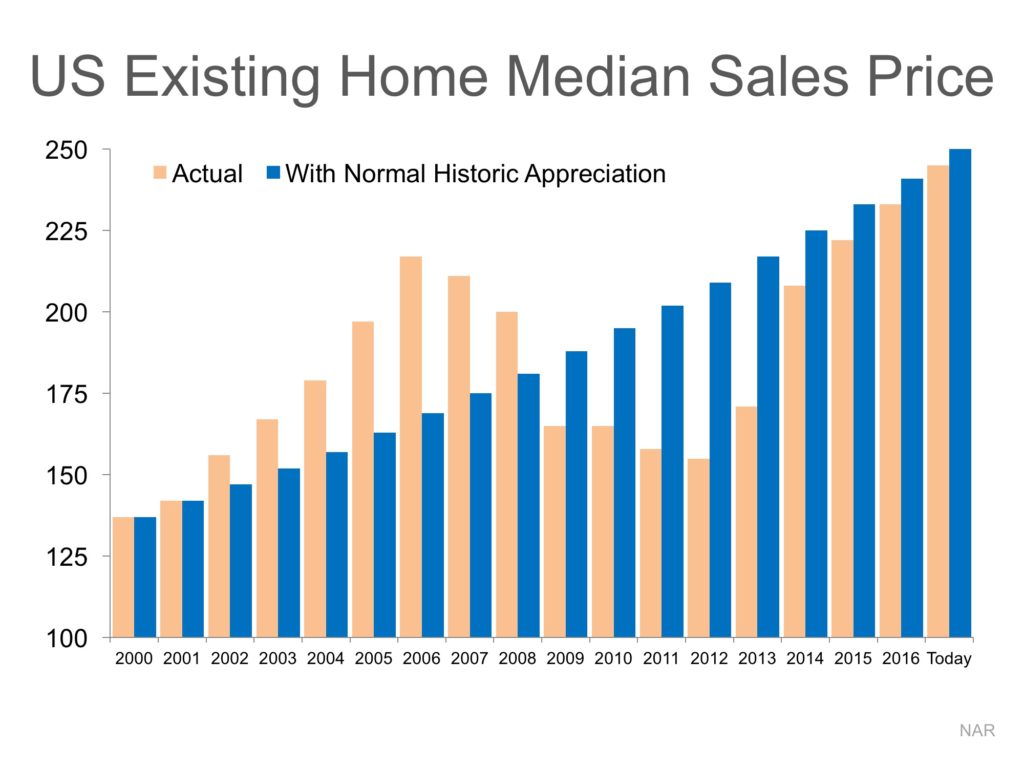
However, let’s assume there was no housing bubble and crash and that home prices appreciated at normal historic levels (3.6% annually) over the last ten years.
Here is a graph comparing actual price appreciation (tan bars) with what prices would have been with normal appreciation (blue bars).
Bottom Line
As we can see, had there not been a boom and bust, home values would essentially be where they are right now.
Posted in For Buyers, For Sellers, Housing Market Updates, Pricing
The TRUTH Behind the RENT vs. BUY Debate
Jun
14
2017

In a blog post published last Friday, CNBC’s Diana Olnick reported on the latest results of the FAU Buy vs. Rent Index. The index examines the entire US housing market and then isolates 23 major markets for comparison. The researchers at FAU use a “‘horse race’ comparison between an individual that is buying a home and an individual that rents a similar-quality home and reinvests all monies otherwise invested in homeownership.”
Having read both the index and the blog post, we would like to clear up any confusion that may exist. There are three major points that we would like to counter:
1. The Title
The CNBC blog post was titled, “Don’t put your money in a house, says a new report.” The title of the press release about the report on FAU’s website was “FAU Buy vs. Rent Index Shows Rising Prices and Mortgage Rates Moving Housing Markets in the Direction of Renting.”
Now, we all know headlines can attract readers and the stronger the headline the more readership you can attract, but after dissecting the report, this headline may have gone too far. The FAU report notes that rising home prices and the threat of increasing mortgage rates could make the decision of whether to rent or to buy a harder one in three metros, but does not say not to buy a home.
2. Mortgage Interest Rates are Rising
According to Freddie Mac, mortgage interest rates reached their lowest mark of 2017 last week at 3.89%. Interest rates have hovered around 4% for the majority of 2017, giving many buyers relief from rising home prices and helping with affordability.
While experts predict that rates will increase by the end of 2017, the latest projections have softened, with Freddie Mac predicting that rates will rise to 4.3% in Q4.
3. “Renting may be a better option than buying, according to the report.”
Of the 23 metros that the study reports on, 11 of them are firmly in buy territory, including New York, Boston, Chicago, Cleveland, and more. This means that in nearly half of all the major cities in the US, it makes more financial sense to buy a home than to continue renting one.
In 9 of the remaining metros, the decision as to whether to rent or buy is closer to a toss-up right now. This means that all things being equal, the cost to rent or buy is nearly the same. That leaves the decision up to the individual or family as to whether they want to renew their lease or buy a home of their own.
The 3 remaining metros Dallas, Denver and Houston, have experienced high levels of price appreciation and have been reported to be in rent territory for well over a year now, so that’s not news…
Beer & Cookies
One of the three authors of the study, Dr. Ken Johnson has long reported on homeownership and the decision between renting and buying a home. The methodology behind the report goes on to explain that even in a market where a renter would be able to spend less on housing, they would have to be disciplined enough to reinvest their remaining income in stocks/bonds/other investments for renting a home to be a more attractive alternative to buying.
Johnson himself has said:
“However, in perhaps a more realistic setting where renters can spend on consumption (beer, cookies, education, healthcare, etc.), ownership is the clear winner in wealth accumulation. Said another way, homeownership is a self-imposed savings plan on the part of those that choose to own.”
Bottom Line
In the end, you and your family are the only ones who can decide if homeownership is the right path to go down. Real estate is local and every market is different. Let’s get together to discuss what’s really going on in your area and how we can help you make the best, most informed decision for you and your family.
Posted in First Time Home Buyers, For Buyers, Housing Market Updates
Inventory Challenges Continue! [INFOGRAPHIC]
May
26
2017

Some Highlights:
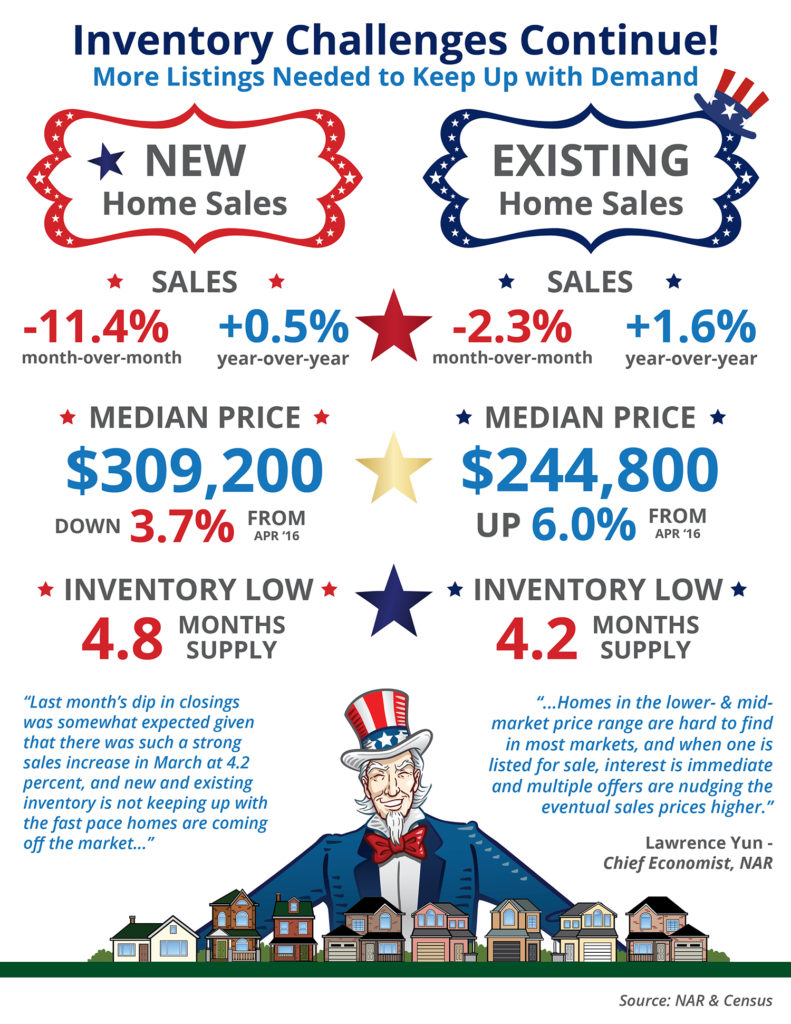
- After a surge in March, existing home sales and new home sales slowed due to a drop in inventory available for sale in the start-up and trade-up categories.
- Median existing home prices surged for the 62nd straight month, up 6.0% over last year to $244,800.
- New home prices slowed as builders have started to turn their focus toward single family, smaller homes.
Posted in First Time Home Buyers, For Buyers, For Sellers, Housing Market Updates, Infographics, Move-Up Buyers
How’s the Real Estate Market? Find Out What the Experts Are Saying
May
25
2017

As we head into summer, it is a great time to review how the 2017 real estate market is doing so far. Here is what the experts are saying:
Doug Duncan, Fannie Mae Chief Economist
“Positive demographic factors should continue to reshape the housing market, as rising employment and incomes appear to be positively influencing millennial homeownership rates.”
Diana Olick, CNBC
“Even as more homes come on the market for this traditionally popular sales season, they’re flying off fast, with bidding wars par for the course. Home prices have now surpassed their last peak, and at the entry level, where demand is highest, sellers are firmly in the driver’s seat.”
Daren Blomquist, Senior VP at Attom
“I am guessing we will see it get even better… If you are considering moving, it could be a really good time to sell.”
Lawrence Yun, NAR Chief Economist
“The early returns so far this spring buying season look very promising as a rising number of households dipped their toes into the market and were successfully able to close on a home last month. Although finding available properties to buy continues to be a strenuous task for many buyers, there was enough of a monthly increase in listings…for sales to muster a strong gain. Sales will go up as long as inventory does.”
Mark Fleming, First American Chief Economist
“Despite higher mortgage rates, the potential for home sales increased on an annual basis driven by steady income and job growth, along with a surge in building permits. While it may be a little late for this spring, the increase in building permits is a welcome sign that some relief may be in sight for the inventory shortages that are holding back many markets from realizing their full potential this spring.”
Posted in For Buyers, For Sellers, Housing Market Updates
Is Now a Good Time to Rent?
May
23
2017

People often ask if now is a good time to buy a home, but nobody ever asks when a good time to rent is. Regardless, we want to make certain that everyone understands that today is NOT a good time to rent.
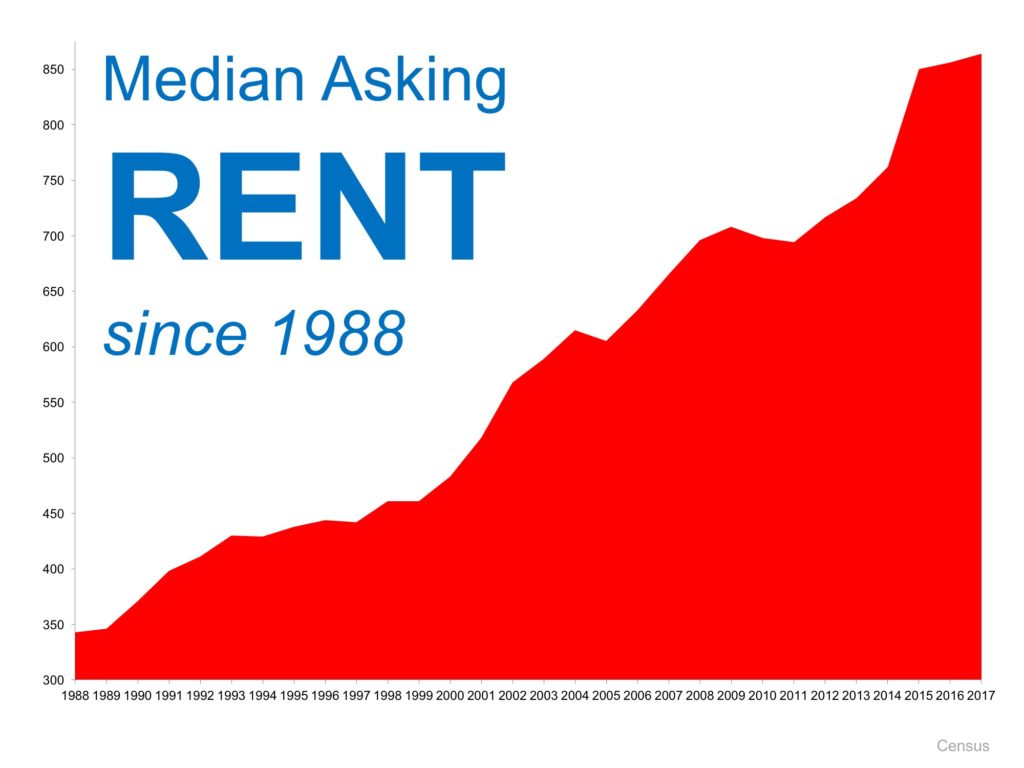
The Census Bureau recently released their 2017 first quarter median rent numbers. Here is a graph showing rent increases from 1988 until today:
As you can see, rents have steadily increased and are showing no signs of slowing down. If you are faced with making the decision of whether or not you should renew your lease, you might be pleasantly surprised at your ability to buy a home of your own instead.
Bottom Line
One way to protect yourself from rising rents is to lock in your housing expense by buying a home. If you are ready and willing to buy, let’s meet to determine if you are able to today!
Posted in First Time Home Buyers, For Buyers, Housing Market Updates, Move-Up Buyers
