Instant Home Estimate
For your home value estimate, enter the access code you received on the postcard, just click here:


The price of any item is determined by the supply of that item, as well as the market demand. The National Association of REALTORS (NAR) surveys “over 50,000 real estate practitioners about their expectations for home sales, prices and market conditions” for their monthly REALTORS Confidence Index.
Their latest edition sheds some light on the relationship between Seller Traffic (supply) and Buyer Traffic (demand).
The map below was created after asking the question: “How would you rate buyer traffic in your area?”
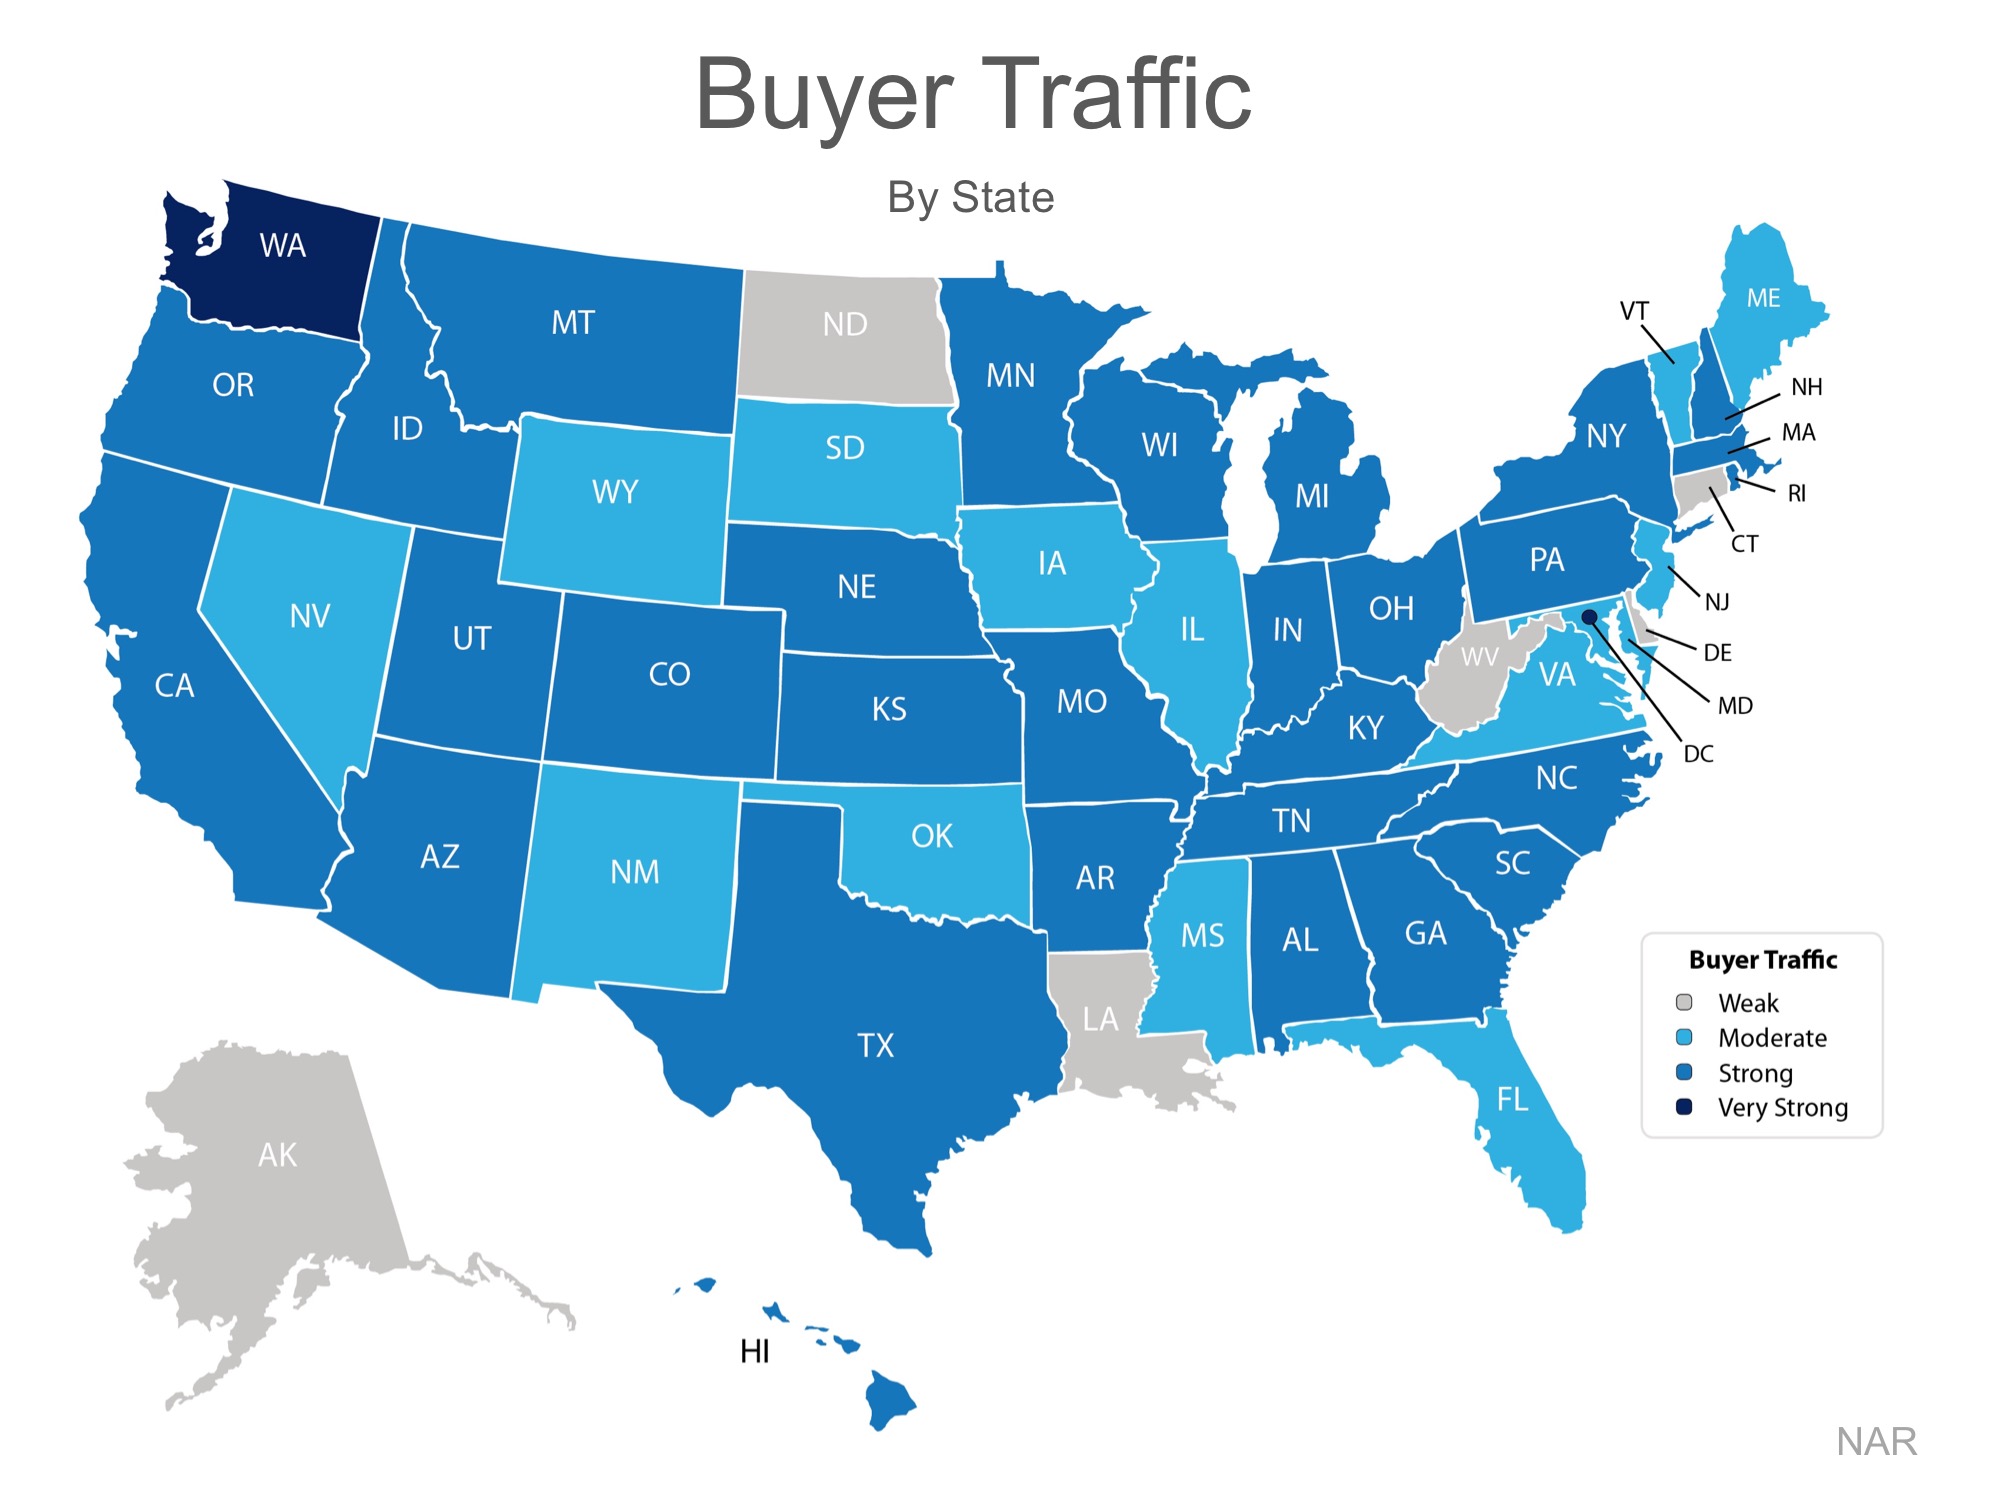
The darker the blue, the stronger the demand for homes in that area. Only six states had a weak demand level.
The Index also asked: “How would you rate seller traffic in your area?”
As you can see from the map below, the majority of the country has weak Seller Traffic, meaning there are far fewer homes on the market than what is needed to satisfy the buyers who are out looking for their dream homes.
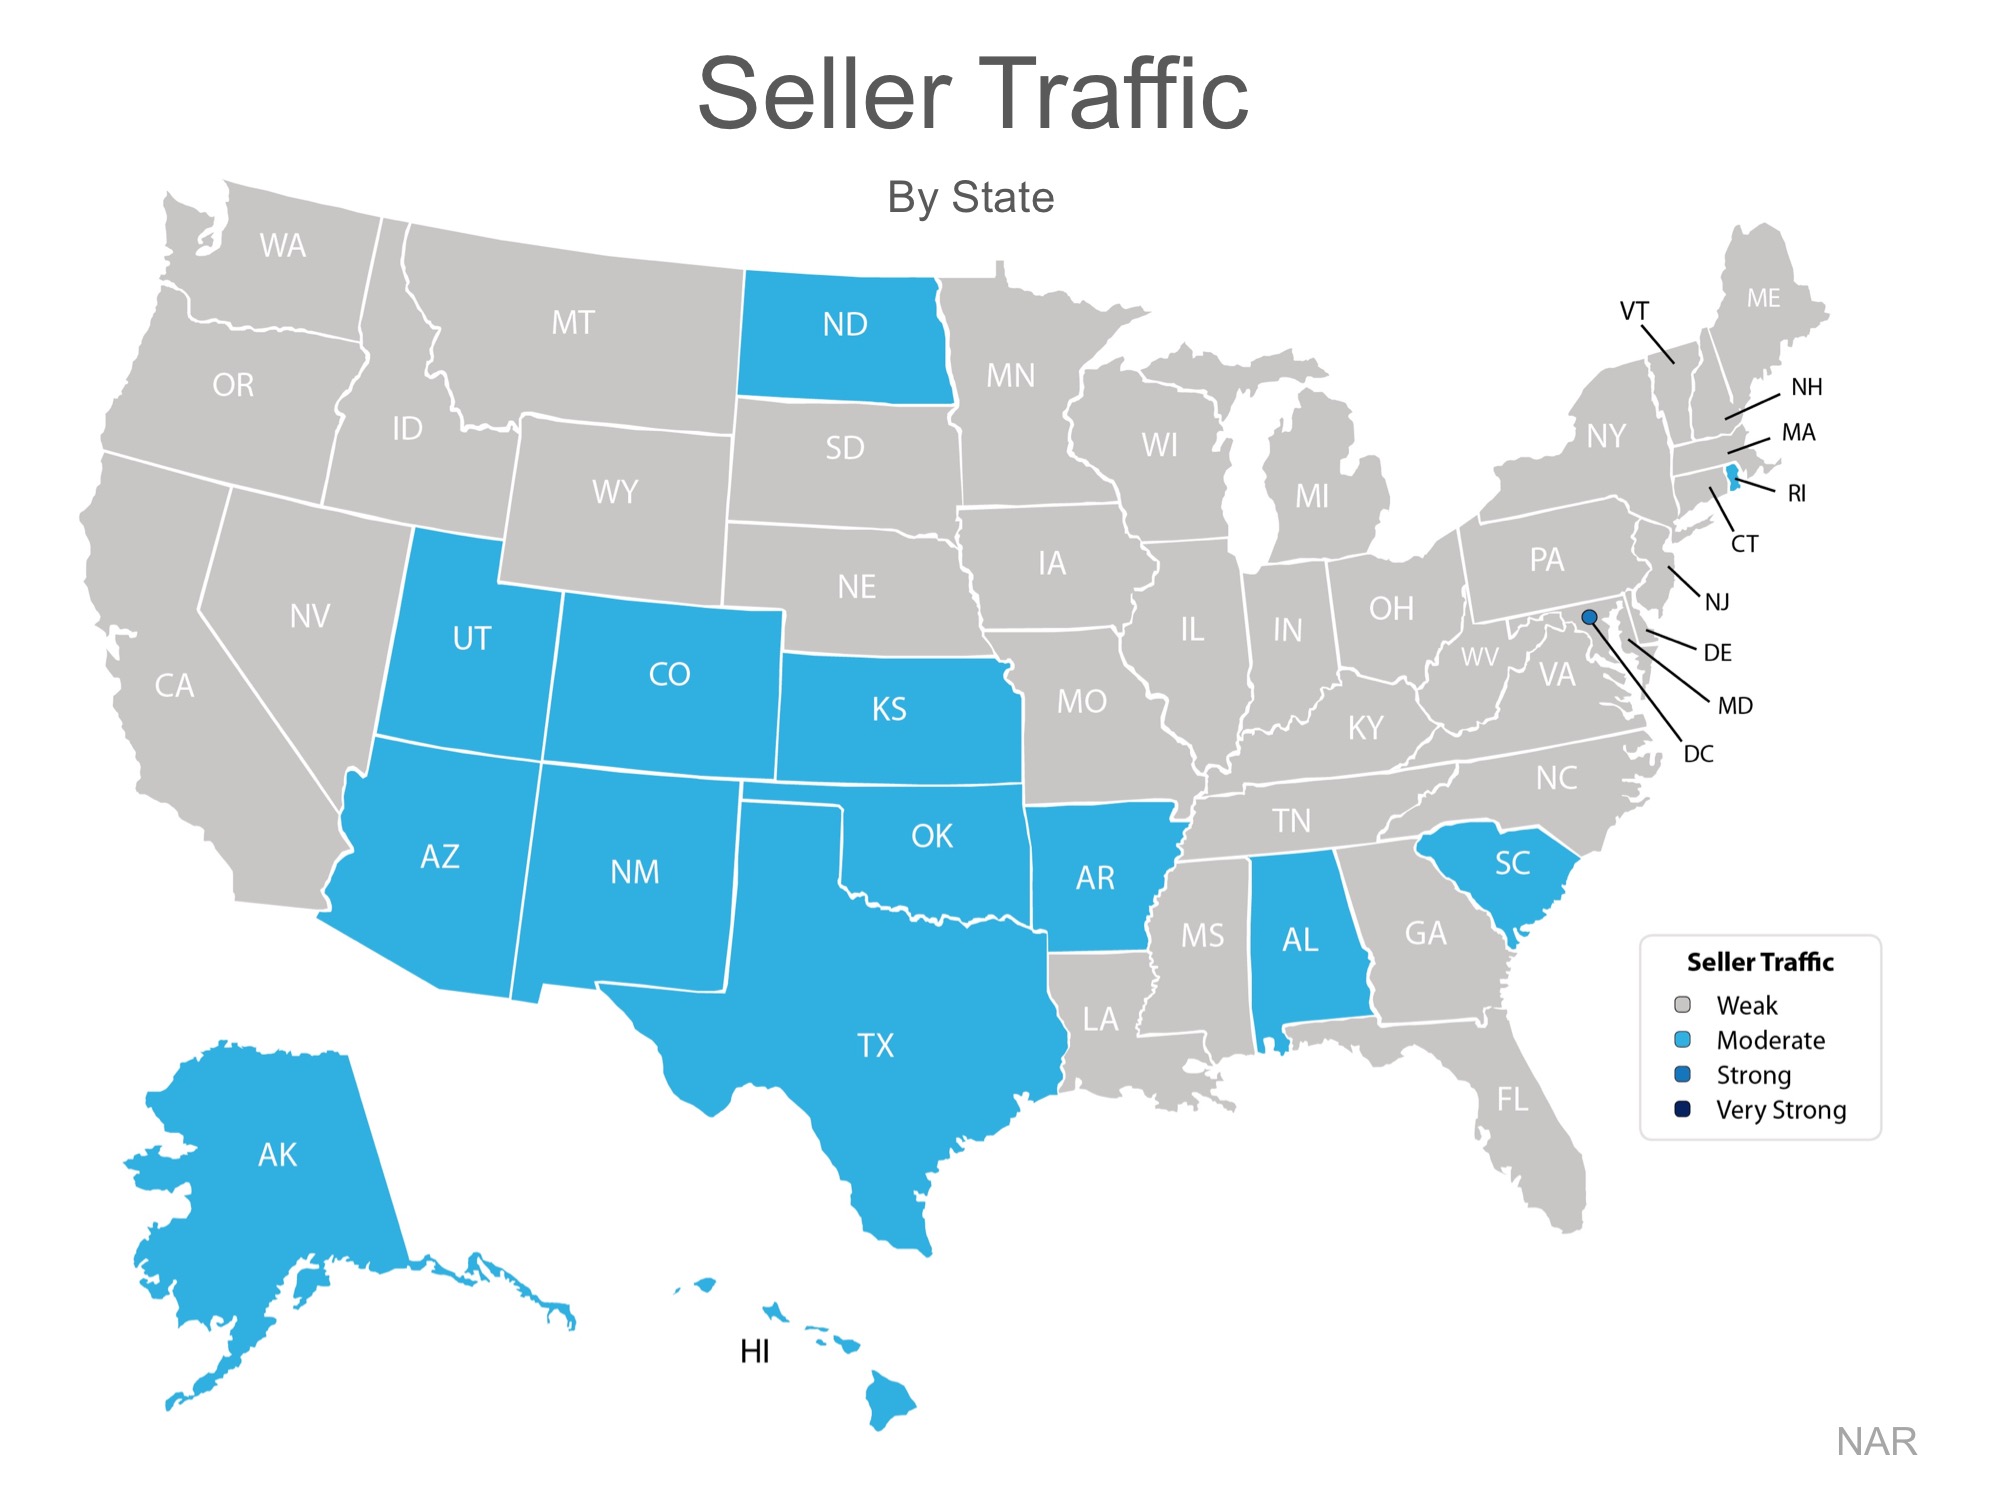
Looking at the maps above, it is not hard to see why prices are appreciating in many areas of the country. Until the supply of homes for sale starts to meet the buyer demand, prices will continue to increase. If you are debating listing your home for sale, let’s get together to help you capitalize on the demand in the market now!
Posted in For Buyers, For Sellers, Housing Market Updates
![Sales at Highest Pace in 10 Years! [INFOGRAPHIC]](http://marketinfo.southbaylifestylehomes.com/wp-content/uploads/2017/01/20170127-Highest-Sales-STM.jpg)
Posted in First Time Home Buyers, For Buyers, For Sellers, Housing Market Updates, Move-Up Buyers

According to ATTOM Data Solutions’ 2017 Rental Affordability Report, buying a home is more affordable than renting in 354 of the 540 U.S. counties they analyzed.
The report found that “making monthly house payments on a median-priced home — including mortgage, property taxes and insurance — is more affordable than the fair market rent on a three-bedroom property in 354 of the 540 counties analyzed in the report (66 percent).”
For the report, ATTOM Data Solutions compared recently released fair market rent data from the Department of Housing and Urban Development with reported income amounts from the Department of Labor and Statistics to determine the percentage of income that a family would have to spend on their monthly housing cost (rent or mortgage payments).
Rents have been surging faster than home prices in about 37% of the markets measured. Daren Blomquist, Senior Vice President of ATTOM Data Solutions warns that rising interest rates could be the tipping point of affordability:
“While buying continues to be more affordable than renting in the majority of U.S. markets, that equation could change quickly if mortgage rates keep rising in 2017. In that scenario, renters who have not yet made the leap to homeownership will find it even more difficult to make that leap this year.”
Rents will continue to rise and mortgage interest rates are still at historic lows. Before you sign or renew your next lease, meet with a local professional who can help you determine if you are able to buy a home of your own and lock in your monthly housing expense.
Posted in First Time Home Buyers, For Buyers, Housing Market Updates, Move-Up Buyers

Some industry experts are saying that the housing market may be heading for a slowdown in 2017 based on rising home prices and a jump in mortgage interest rates. One of the data points they use is the Housing Affordability Index, as reported by the National Association of Realtors (NAR).
Here is how NAR defines the index:
“The Housing Affordability Index measures whether or not a typical family earns enough income to qualify for a mortgage loan on a typical home at the national level based on the most recent price and income data.”
Basically, a value of 100 means a family earning the median income earns enough to qualify for a mortgage on a median-priced home, based on the price and mortgage interest rates at the time. Anything above 100 means the family has more than enough to qualify.
The higher the index, the easier it is to afford a home.
The index has been declining over the last several years as home values increased. Some are concerned that too many buyers could be priced out of the market.
But, wait a minute…
Though the index skyrocketed from 2009 through 2013, we must realize during that time the housing crisis left the market with an overabundance of housing inventory with as many as one out of three listings being a distressed property (foreclosure or short sale). All prices dropped dramatically and distressed properties sold at major discounts. Then, mortgage rates fell like a rock.
The market is recovering, and values are coming back nicely. That has caused the index to fall.
However, let’s remove the crisis years and look at the current index as compared to the index from 1990 – 2008:
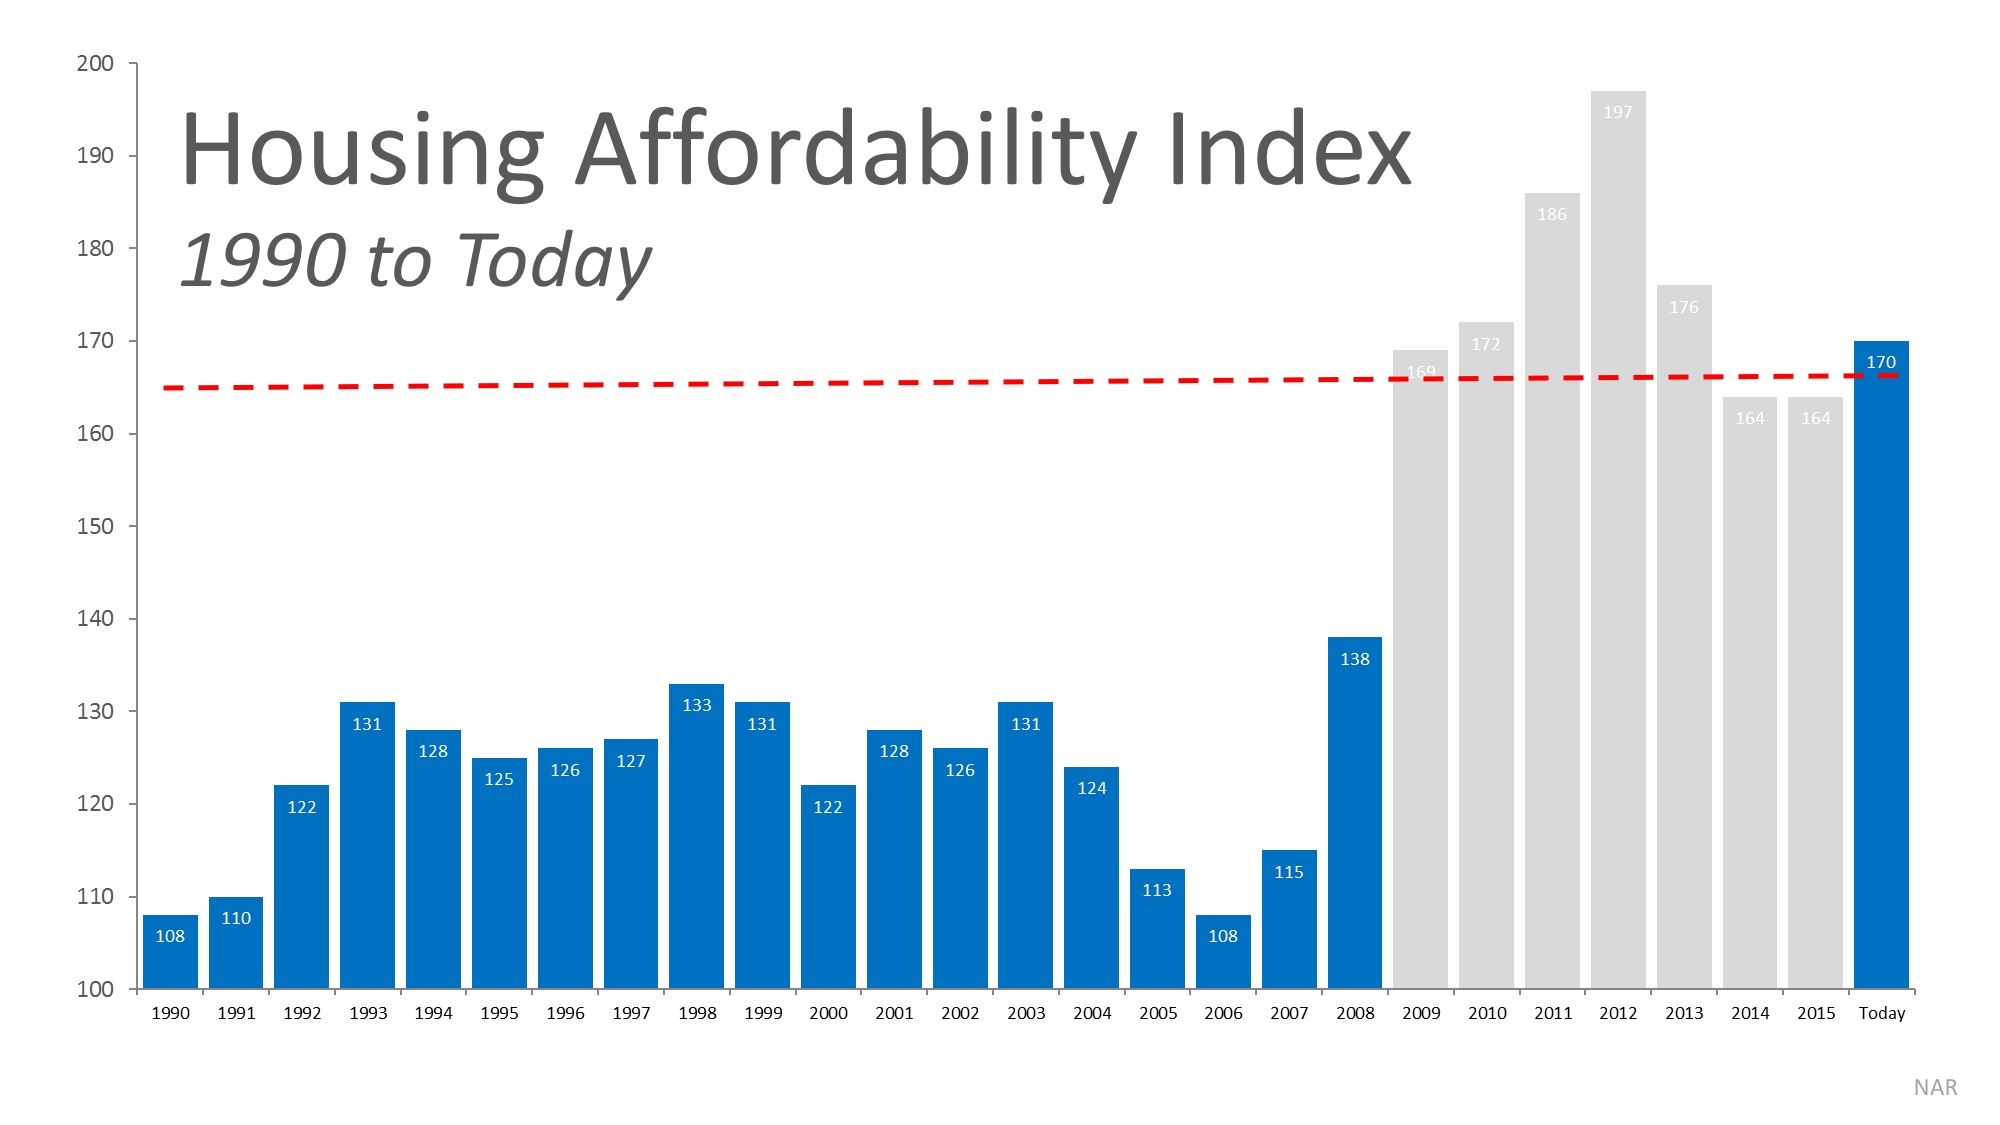
We can see that, even though prices have increased, mortgage rates are still lower than historical averages and have put the index in a better position than every year for the nineteen years before the crash.
The Housing Affordability Index is in great shape and should not be seen as a challenge to the real estate market’s continued recovery.
Posted in First Time Home Buyers, For Buyers, Housing Market Updates, Move-Up Buyers

Recently released data from the National Center for Health Statistics revealed that 1.3 million Millennial women gave birth for the first time in 2015. There are now over 16 million women in this generation who have become mothers.
“All told, Millennial women (those born between 1981 to 1997) accounted for about eight in ten (82%) of U.S. births in 2015.”
The data also shows that this generation has waited until later in life to become parents as only 42% of Millennial women were moms in 2014, compared to 49% of Generation X at the same age. A Pew Research Center article discussing the data, points to social influences that may have contributed to the delay:
“The rising age at first birth is hardly limited to the Millennial generation. It has been a trend since at least 1970. Many factors may contribute, including a shift away from marriage, increasing educational attainment and the movement of women into the labor force.”
“While Millennials may be delaying parenthood, it’s not for a lack of interest in eventually becoming moms and dads. Members of this generation rated being a good parent as a top priority in a 2010 Pew Research Center survey.
Some 52% said it was one of the most important goals in their lives, well ahead of having a successful marriage, which 30% said was one of their most important lifetime goals.”
As Jonathan Smoke, Chief Economist for realtor.com explained: “At any given time in our history, demographics would explain 60-80% of what’s happening [in the market], and we are in a period of time where Millennials make up a largest demographic group.”
As more and more Millennial families are formed, this generation will shift their focus to providing the best home for their children to grow up in, the best school districts, and often to the stability that owning a home of their own provides.
Two-thirds of Millennials have not yet reached the average first-time home buying age of 32, as reported by the National Association of Realtor. The homeownership rate amongst Millennials has nowhere to go but up!
Millennials as a generation have delayed traditional social norms until later in their lives. Whether getting married, having children or buying a home, the desire to provide for their family is still there, even if it takes a little while longer than it did for previous generations.
Posted in First Time Home Buyers, For Buyers, Housing Market Updates, Millennials
![Prices Rose 7.1% Year-Over-Year [INFOGRAPHIC] | Simplifying The Market](http://d2d6tznlfad433.cloudfront.net/wp-content/uploads/2017/01/20170113-Prices-YOY-STM.jpg)
Posted in Housing Market Updates, Infographics, Pricing

The National Association of Realtors’ most recent Existing Home Sales Report revealed that, compared to last year, home sales are up dramatically in five of the six price ranges they measure.
Homes priced between $100-250K showed a 20.7% increase year-over-year. This is an impressive increase, showing that November was an excellent month for home sales in this price range.
But surprisingly, the 20.7% increase in sales in this range was not the highest percent change achieved, as sales of homes over $250,000 increased by double-digit percentages with sales in the $750,000- $1 million range showing the largest increase, up 43.2%!
As prices in many markets continue to accelerate, it is no surprise to see the percentage of homes in the higher price ranges increasing.
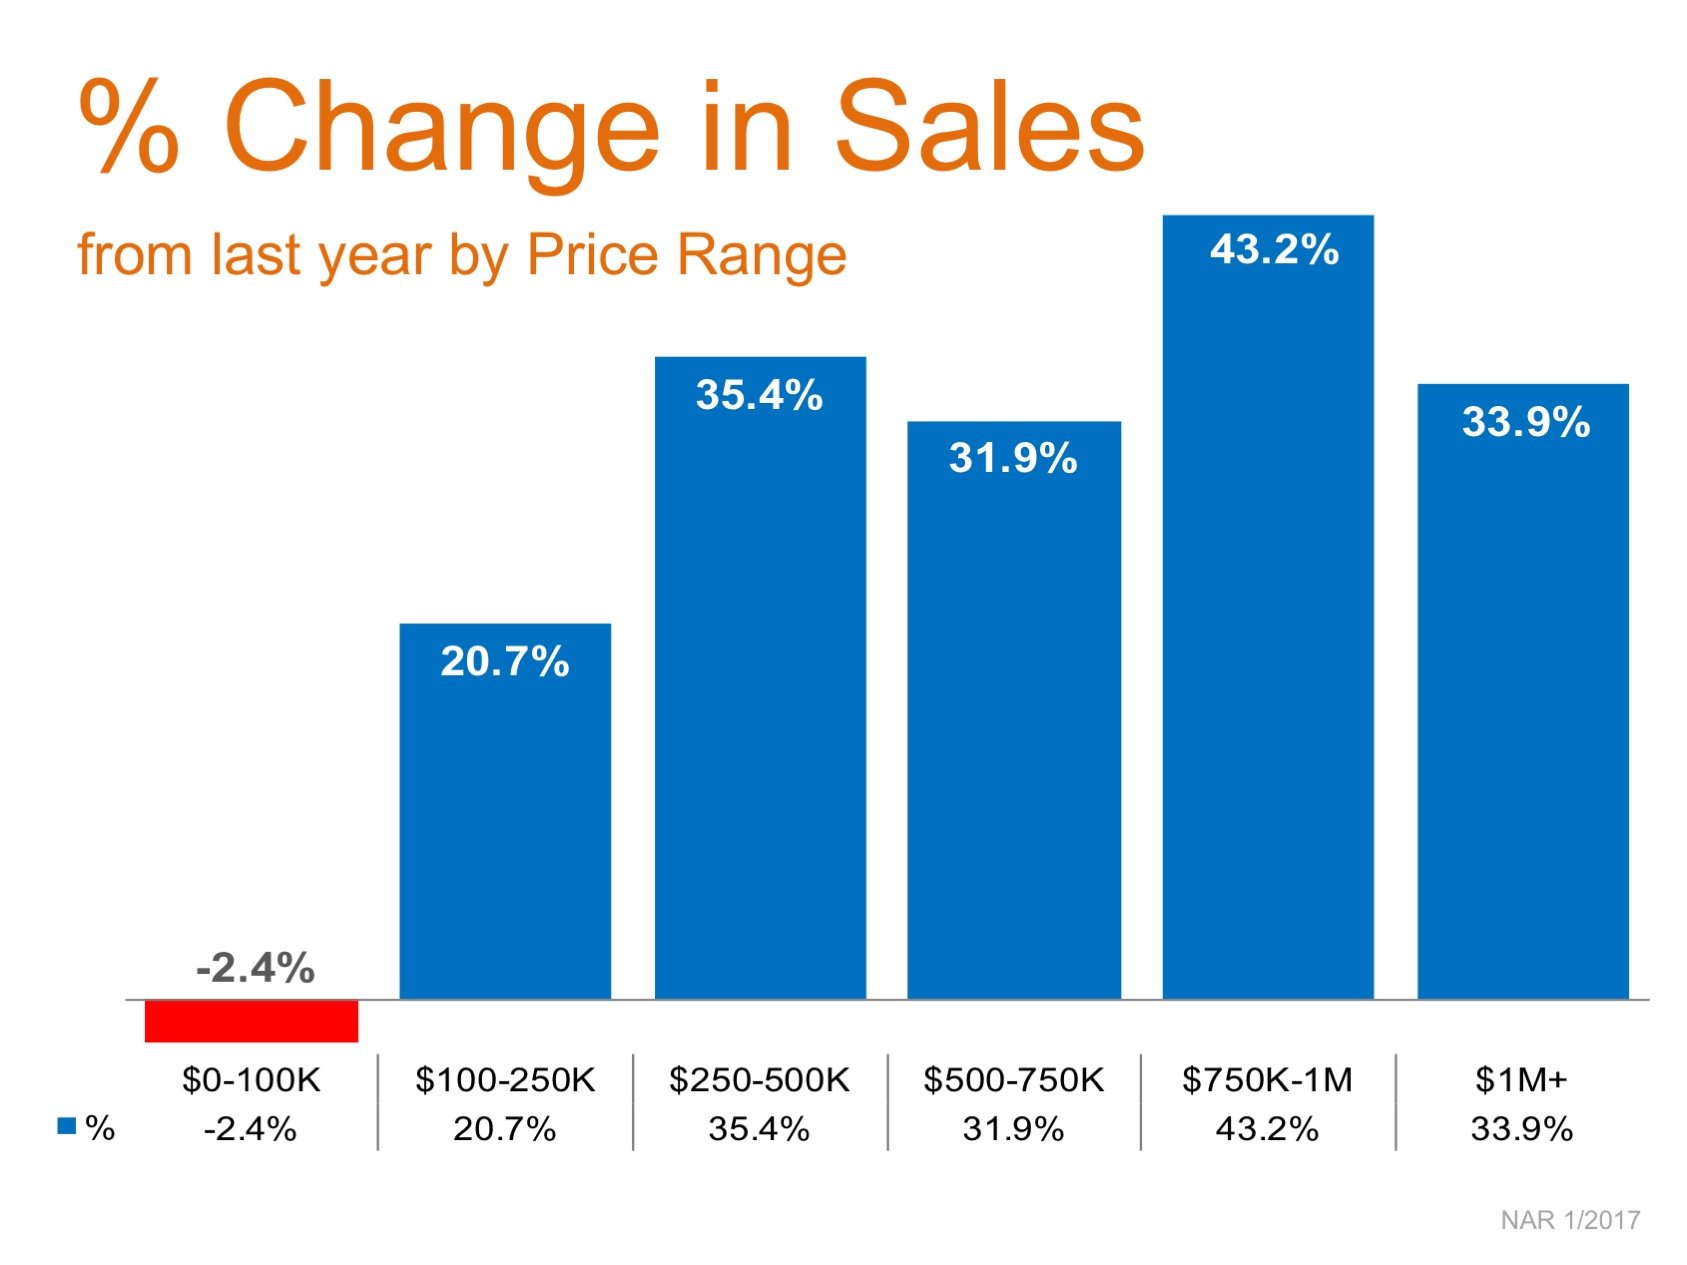
Homes under $100,000 were the only group to show negative appreciation of sales at -2.4%. This not only points to the lower inventory of homes available for sale in this price range but also speaks to the overall strength of the housing market.
Houses are definitely selling. If your house has been on the market for any length of time and has not yet sold, perhaps it is time to sit down with your agent to see if it is priced appropriately to compete in today’s market.
Posted in For Buyers, For Sellers, Housing Market Updates
The latest Existing Home Sales Report from the National Association of Realtors (NAR) revealed a direct correlation between a lack of inventory and rising prices.
We are all familiar with the concept of supply and demand. As the demand for an item increases the supply of that same item goes down, driving prices up.
Year-over-year inventory levels have dropped each of the last 18 months, as inventory now stands at a 4.0-month supply, well below the 6.0-month supply needed for a ‘normal’ market.
The median price of homes sold in November (the latest data available) was $234,900, up 6.8% from last year and marking the 57th consecutive month with year-over-year gains.
NAR’s Chief Economist, Lawrence Yun had this to say:
“Existing housing supply at the beginning of the year was inadequate and is now even worse heading into 2017. Rental units are also seeing this shortage. As a result, both home prices and rents continue to far outstrip incomes in much of the country.”
But there is good news about rising prices. More and more homeowners are recovering from a negative equity situation and learning that they are able to sell their homes and either move up to their dream home or downsize to a property that will better suit their needs. Look for these homes to come to market soon.
Buyer demand continues to outpace the supply of homes for sale. Listing your home in the winter attracts serious buyers who are looking to close the transaction quickly.
Posted in For Sellers, Housing Market Updates, Pricing

As we are about to bring in the New Year, families across the country will be deciding if this is the year that they will sell their current house and move into their dream home. Many will decide that it is smarter to wait until the spring “buyer’s market” to list their house. In the past, that might have made sense. However, this winter is not like recent years.
The recent jump in mortgage rates has forced buyers off the fence and into the market, resulting in incredibly strong demand RIGHT NOW!! At the same time, inventory levels of homes for sale have dropped dramatically as compared to this time last year.
Here is a chart showing the decrease in inventory levels by category:
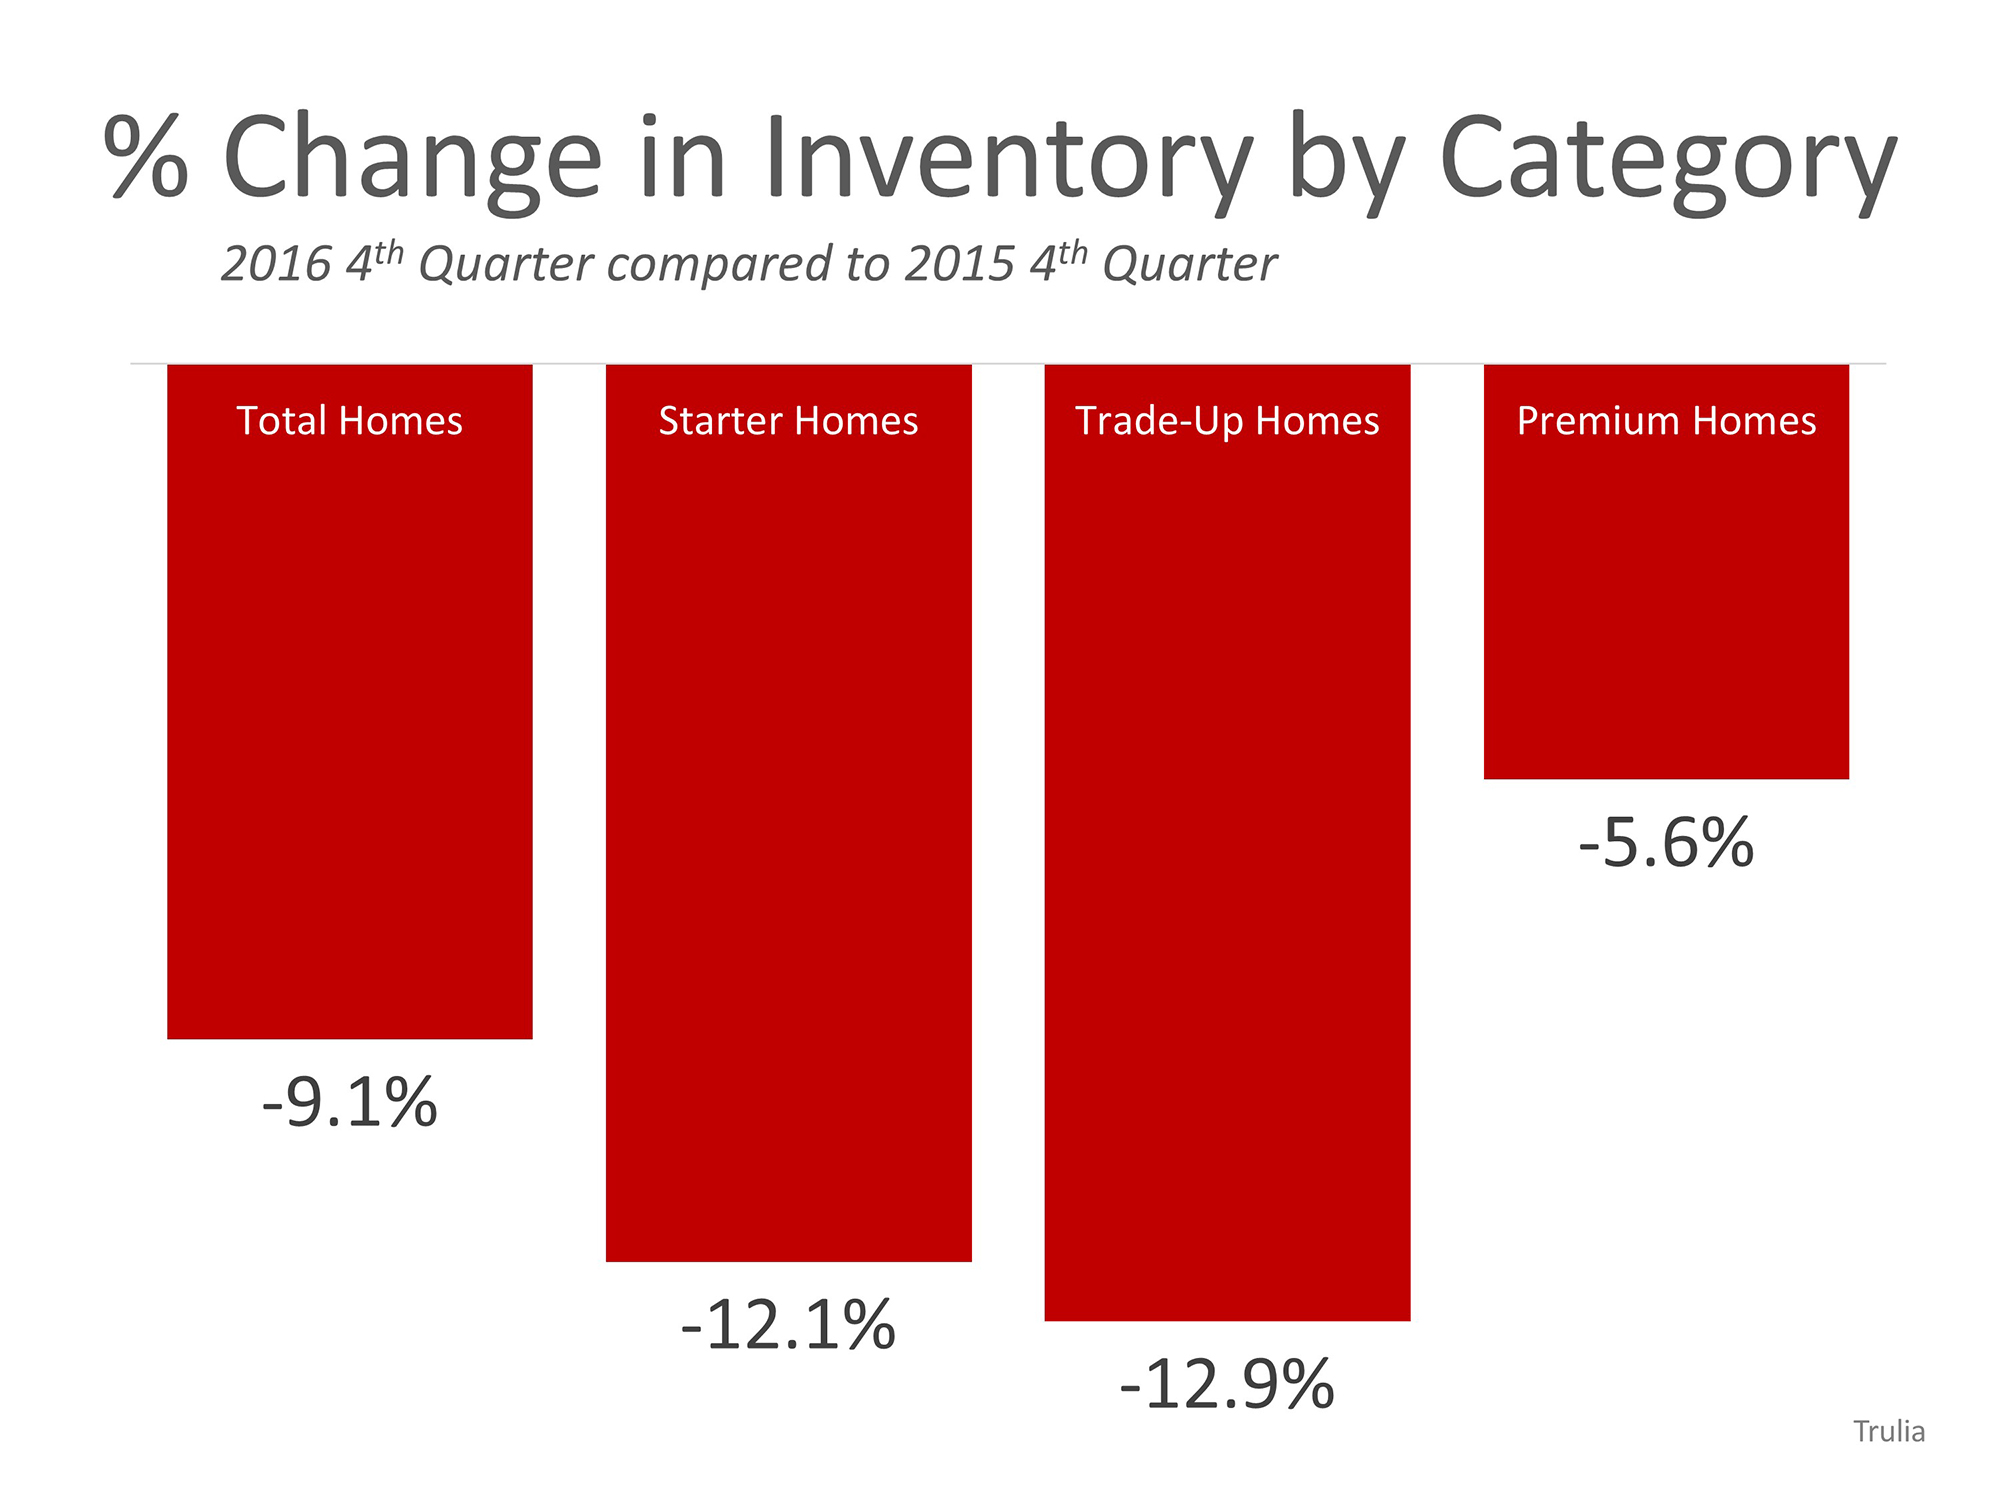
Demand for your home is very strong right now while your competition (other homes for sale) is at a historically low level. If you are thinking of selling in 2017, now may be the time.
Posted in For Sellers, Housing Market Updates

Posted in First Time Home Buyers, For Buyers, For Sellers, Housing Market Updates, Infographics, Move-Up Buyers
For your home value estimate, enter the access code you received on the postcard, just click here: