Category: Pricing
14,904 Homes Sold Yesterday… Did Yours?
Sep
04
2017

There are some homeowners who are patiently waiting to get the price they hoped for when they originally listed their houses for sale. Something these homeowners might want to take into consideration is the fact that if their homes haven’t sold yet, maybe they’re not priced properly.
After all, 14,904 houses sold yesterday, 14,904 will sell today, and 14,904 will sell tomorrow.
14,904!
This is the average number of homes that sell each and every day in this country, according to the National Association of Realtors’ (NAR) latest Existing Home Sales Report. NAR reported that sales are at an annual rate of 5.44 million. Divide that number by 365 (days in a year) and we can see that, on average, over 14,904 homes sell every day.
The report from NAR also revealed that there is currently only a 4.2-month supply of inventory available for sale (6-months inventory is considered ‘historically normal’).
This means that there are not enough homes available for sale to satisfy all of the buyers who currently are out in the market in record numbers.
Bottom Line
We realize that you want to get the fair market value for your home. However, if it hasn’t sold in today’s active real estate market, perhaps you should reconsider your current asking price.
Posted in For Sellers, Move-Up Buyers, Pricing
Where Are Home Prices Heading in The Next 5 Years?
Aug
29
2017

Today, many real estate conversations center on housing prices and where they may be headed. That is why we like the Home Price Expectation Survey.
Every quarter, Pulsenomics surveys a nationwide panel of over one hundred economists, real estate experts, and investment & market strategists about where they believe prices are headed over the next five years. They then average the projections of all 100+ experts into a single number.
The results of their latest survey:
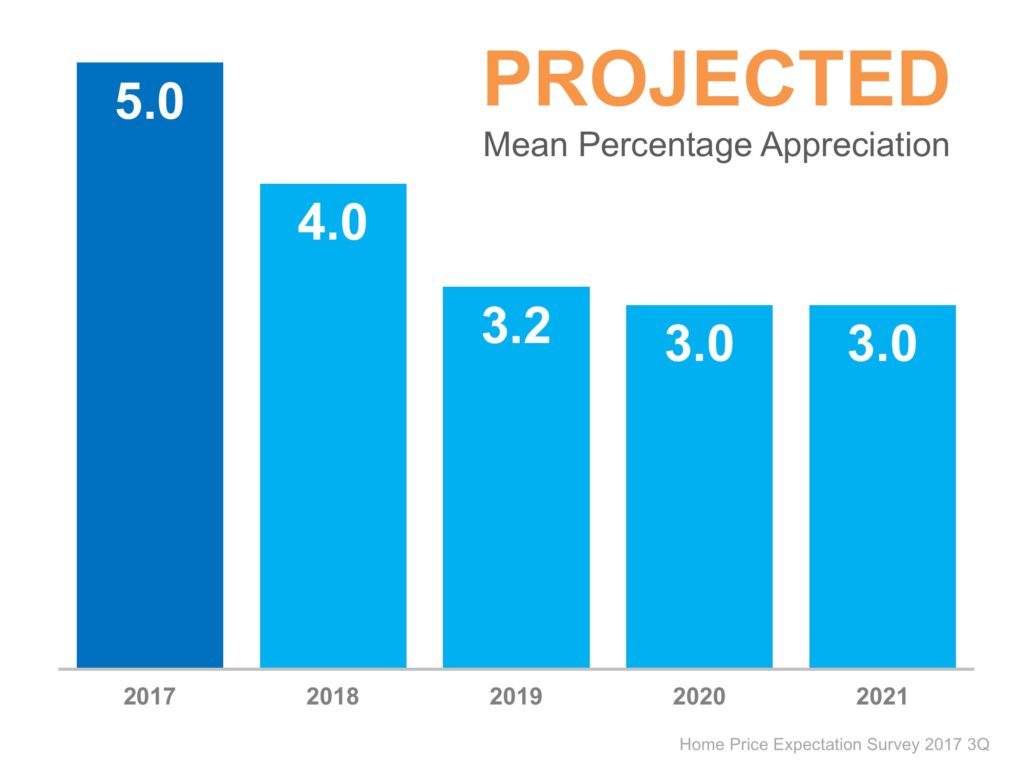
Home values will appreciate by 5.0% over the course of 2017, 4.0% in 2018, 3.2% in 2019, 3.0% in 2020, and 3.0% in 2021. That means the average annual appreciation will be 3.64% over the next 5 years.
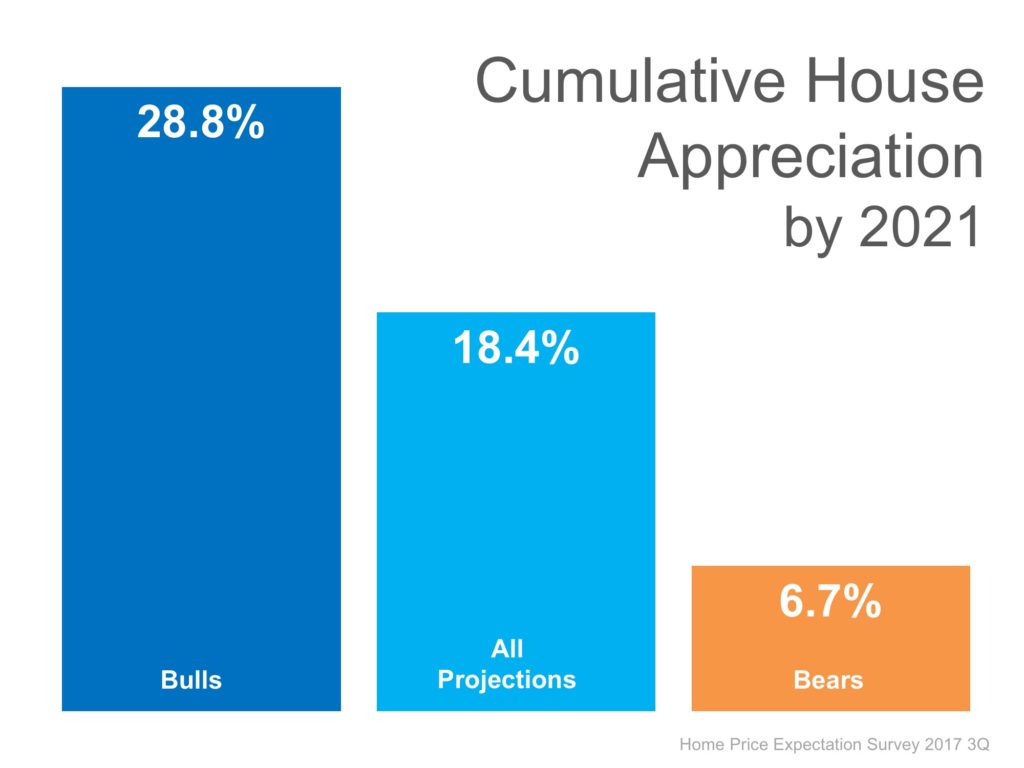
The prediction for cumulative appreciation increased from 17.8% to 18.4% by 2021. The experts making up the most bearish quartile of the survey are projecting a cumulative appreciation of 6.7%.
Bottom Line
Individual opinions make headlines. We believe this survey is a fairer depiction of future values.
Posted in First Time Home Buyers, For Buyers, Housing Market Updates, Move-Up Buyers, Pricing
Home Prices Up 6.64% Across the Country! [INFOGRAPHIC]
Aug
25
2017
![Home Prices Up 6.64% Across the Country! [INFOGRAPHIC] | Simplifying The Market](http://d39ah2zlibpm3g.cloudfront.net/wp-content/uploads/2017/08/24140034/20170825-Share-STM.jpg)
Some Highlights:
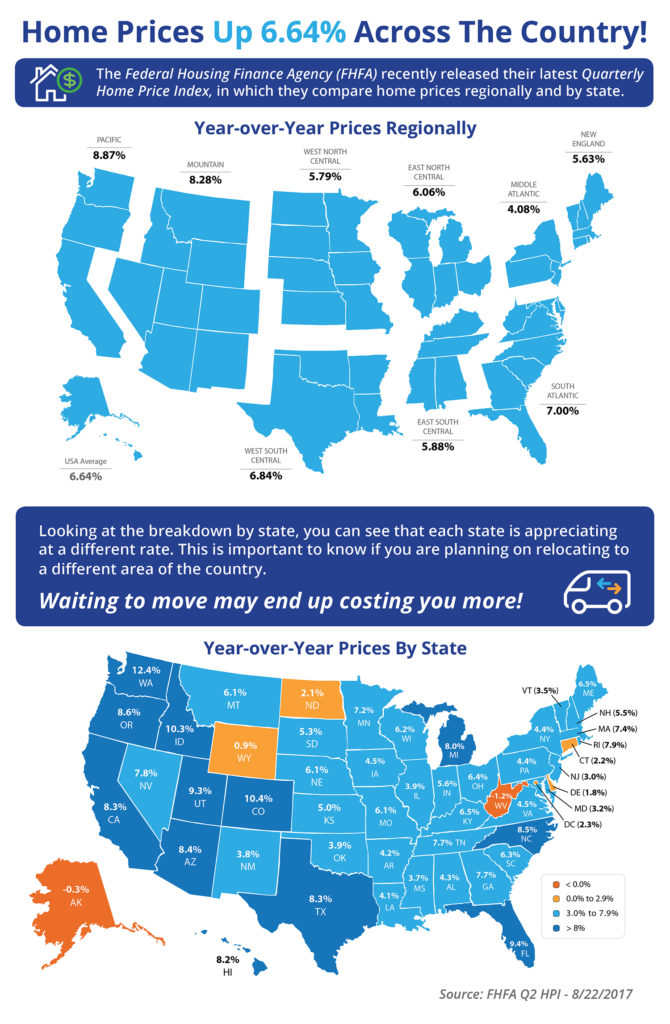
- The Federal Housing Finance Agency (FHFA) recently released their latest Quarterly Home Price Index report.
- In the report, home prices are compared both regionally and by state.
- Based on the latest numbers, if you plan on relocating to another state, waiting to move may end up costing you more!
- Alaska & West Virginia were the only states where home prices are lower than they were last year.
Posted in For Buyers, For Sellers, Infographics, Move-Up Buyers, Pricing
Rising Home Prices Mean Great News for Homeowners
Jul
25
2017

Recently there has been a lot of talk about home prices and if they are accelerating too quickly. As we mentioned before, in some areas of the country, seller supply (homes for sale) cannot keep up with the number of buyers who are out looking for homes, which has caused prices to rise.
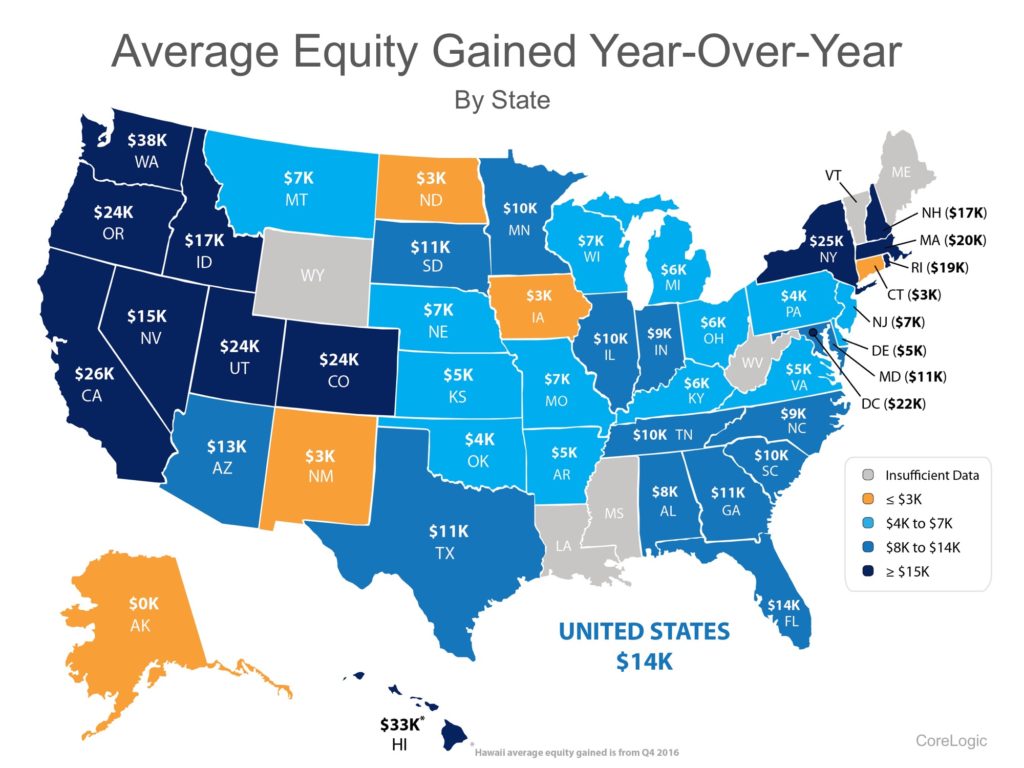
The great news about rising prices, however, is that according to CoreLogic’s Homeowner Equity Report, the average American household gained over $14,000 in equity over the course of the last year, largely due to home value increases.
The map below was created using the same report from CoreLogic and shows the average equity gain per mortgaged home during the 1st quarter of 2017 (the latest data available).
For those who are worried that we are doomed to repeat 2006 all over again, it is important to note that homeowners are investing their new-found equity in their homes and themselves, not in depreciating assets.
The added equity is helping families put their children through college, invest in starting small businesses, pay off their mortgages sooner and even move up to the home that will better suit their needs now.
Bottom Line
If you are a homeowner looking to take advantage of your home equity by moving up to your dream home, let’s get together to discuss your options!
Posted in For Sellers, Move-Up Buyers, Pricing
Are Home Prices Approaching Bubble Territory?
Jun
15
2017

As home values continue to rise, some are questioning whether we are approaching another housing bubble. Zillow just reported that:
“National home values have surpassed the peak hit during the housing bubble and are at their highest value in more than a decade.”
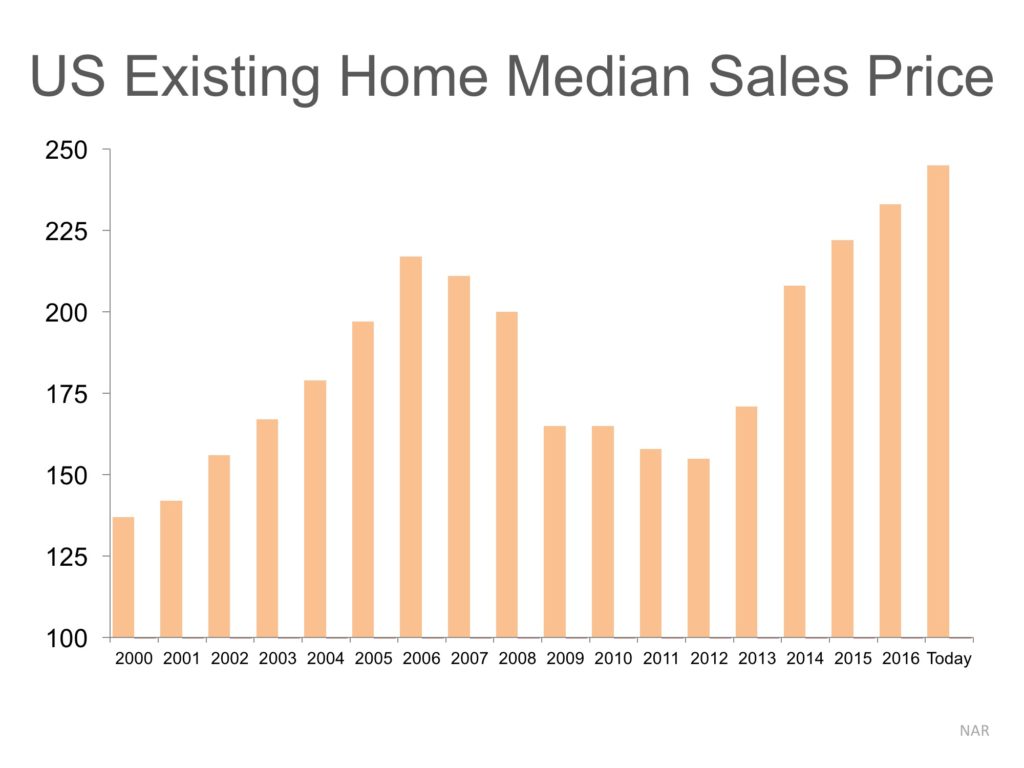
Though that statement is correct, we must realize that just catching prices of a decade ago does not mean we are at bubble numbers. Here is a graph of median prices as reported by the National Association of Realtors (NAR).
We can see that prices rose during the early 2000s, fell during the crash and have risen since 2013.
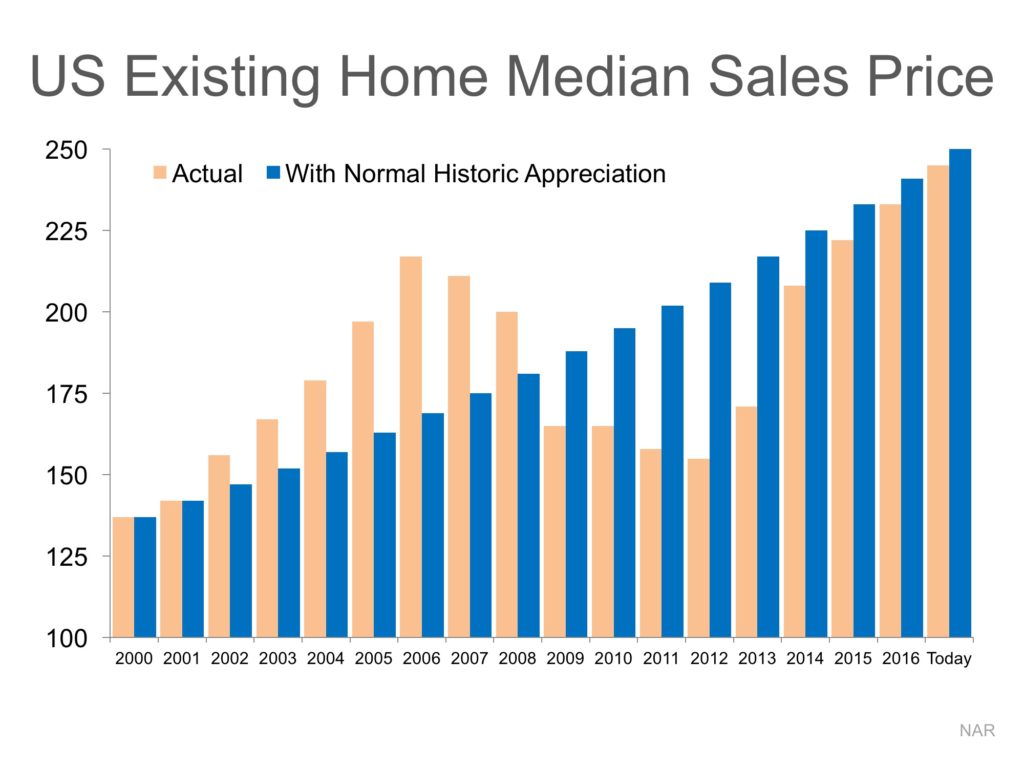
However, let’s assume there was no housing bubble and crash and that home prices appreciated at normal historic levels (3.6% annually) over the last ten years.
Here is a graph comparing actual price appreciation (tan bars) with what prices would have been with normal appreciation (blue bars).
Bottom Line
As we can see, had there not been a boom and bust, home values would essentially be where they are right now.
Posted in For Buyers, For Sellers, Housing Market Updates, Pricing
If Your Home Hasn’t Sold Yet… Definitely Check the Price!
Jun
06
2017
The residential housing market has been hot. Home sales have bounced back solidly and are now at their fourth highest pace over the past year. Demand has remained strong throughout spring as many real estate professionals are reporting bidding wars with many homes selling above listing price. What about your house?
If your house hasn’t sold, it could be the price.
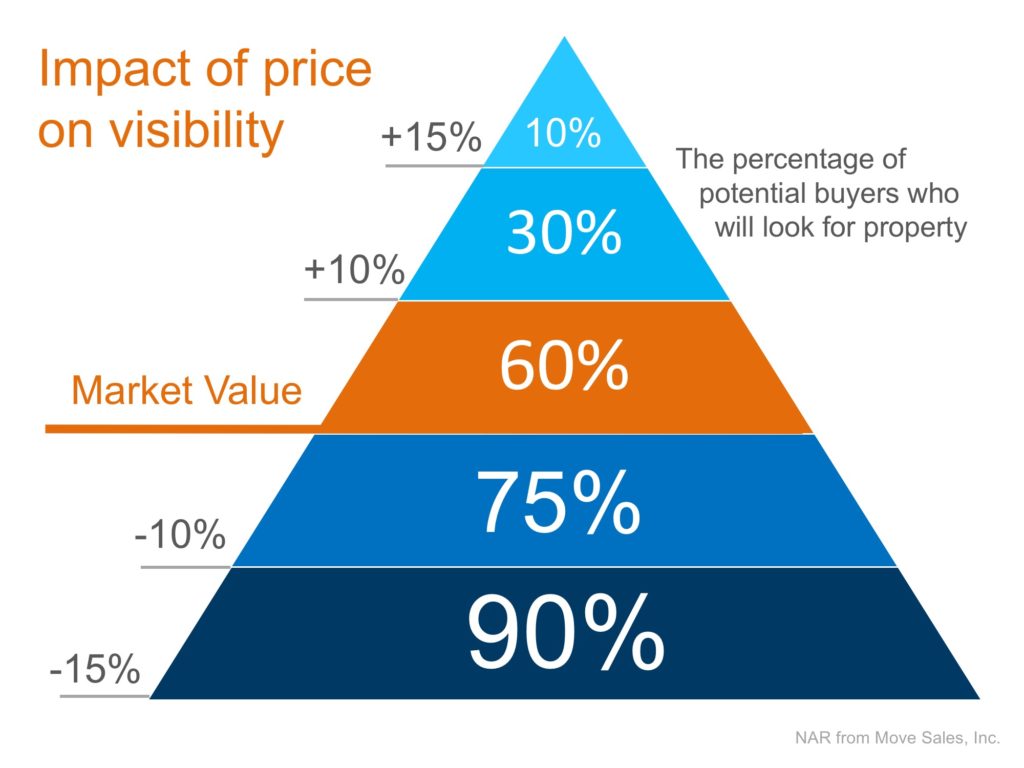
If your home is on the market and you are not receiving any offers, look at your price. Pricing your home just 10% above market value dramatically cuts the number of prospective buyers that will even see your house. See chart below.
Bottom Line
The housing market is hot. If you are not seeing the results you want, sit down with your agent and revisit the pricing conversation.
Posted in For Sellers, Pricing
Do You Know the Cost of Waiting? [INFOGRAPHIC]
May
05
2017
![Do You Know the Cost of Waiting? [INFOGRAPHIC] | Simplifying The Market](http://d39ah2zlibpm3g.cloudfront.net/wp-content/uploads/2017/04/19155321/20170505-Share-STM.jpg)
Some Highlights:
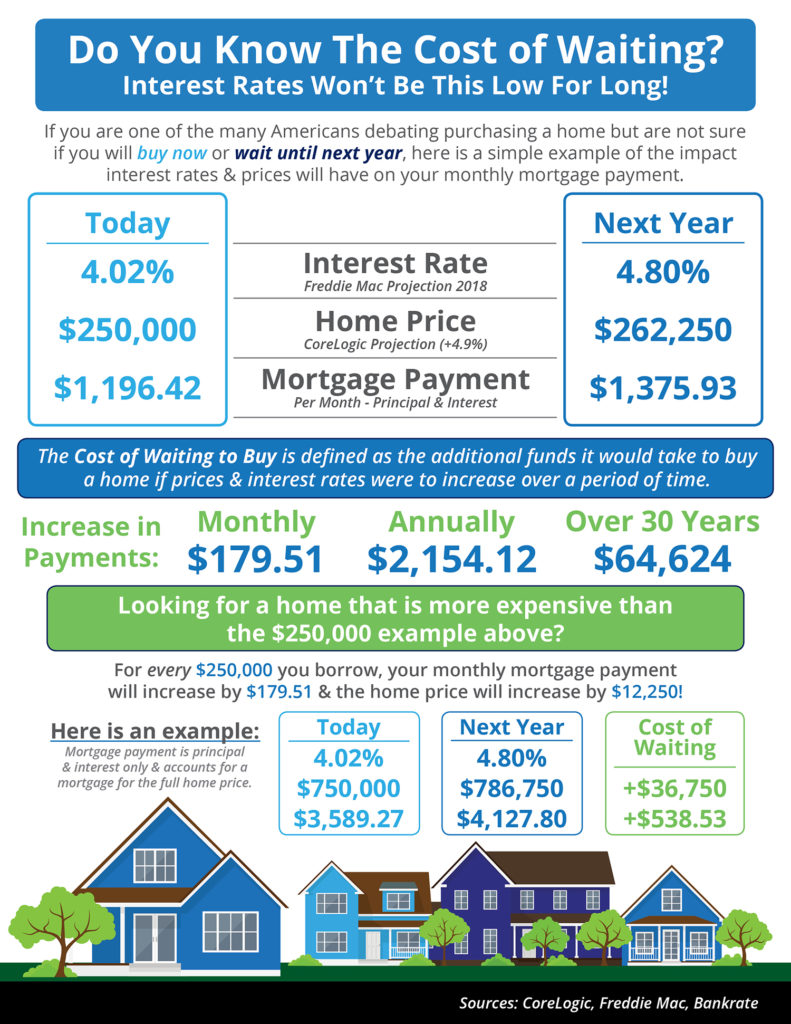
- The “Cost of Waiting to Buy” is defined as the additional funds it would take to buy a home if prices and interest rates were to increase over a period of time.
- Freddie Mac predicts that interest rates will increase to 4.8% by this time next year, while home prices are predicted to appreciate by 4.9% according to CoreLogic.
- Waiting until next year to buy could cost you thousands of dollars a year for the life of your mortgage!
Posted in First Time Home Buyers, For Buyers, Infographics, Interest Rates, Pricing
15,014 Homes Sold Yesterday… Did Yours?
Apr
04
2017
There are some homeowners that have been waiting for months to get a price they hoped for when they originally listed their house for sale. The only thing they might want to consider is… If it hasn’t sold yet, maybe it’s not priced properly.
After all, 15,014 houses sold yesterday, 15,014 will sell today and 15,014 will sell tomorrow.
15,014!
That is the average number of homes that sell each and every day in this country, according to the National Association of Realtors’ (NAR) latest Existing Home Sales Report. NAR reported that sales are at an annual rate of 5.48 million. Divide that number by 365 (days in a year) and we can see that, on average, over 15,014 homes sell every day.
The report from NAR also revealed that there is currently only a 3.8-month supply of inventory available for sale, (6-months inventory is considered ‘historically normal’).
This means that there are not enough homes available for sale to satisfy the buyers who are out in the market now in record numbers.
Bottom Line
We realize that you want to get the fair market value for your home. However, if it hasn’t sold in today’s active real estate market, perhaps you should reconsider your current asking price.
Posted in For Sellers, Housing Market Updates, Pricing
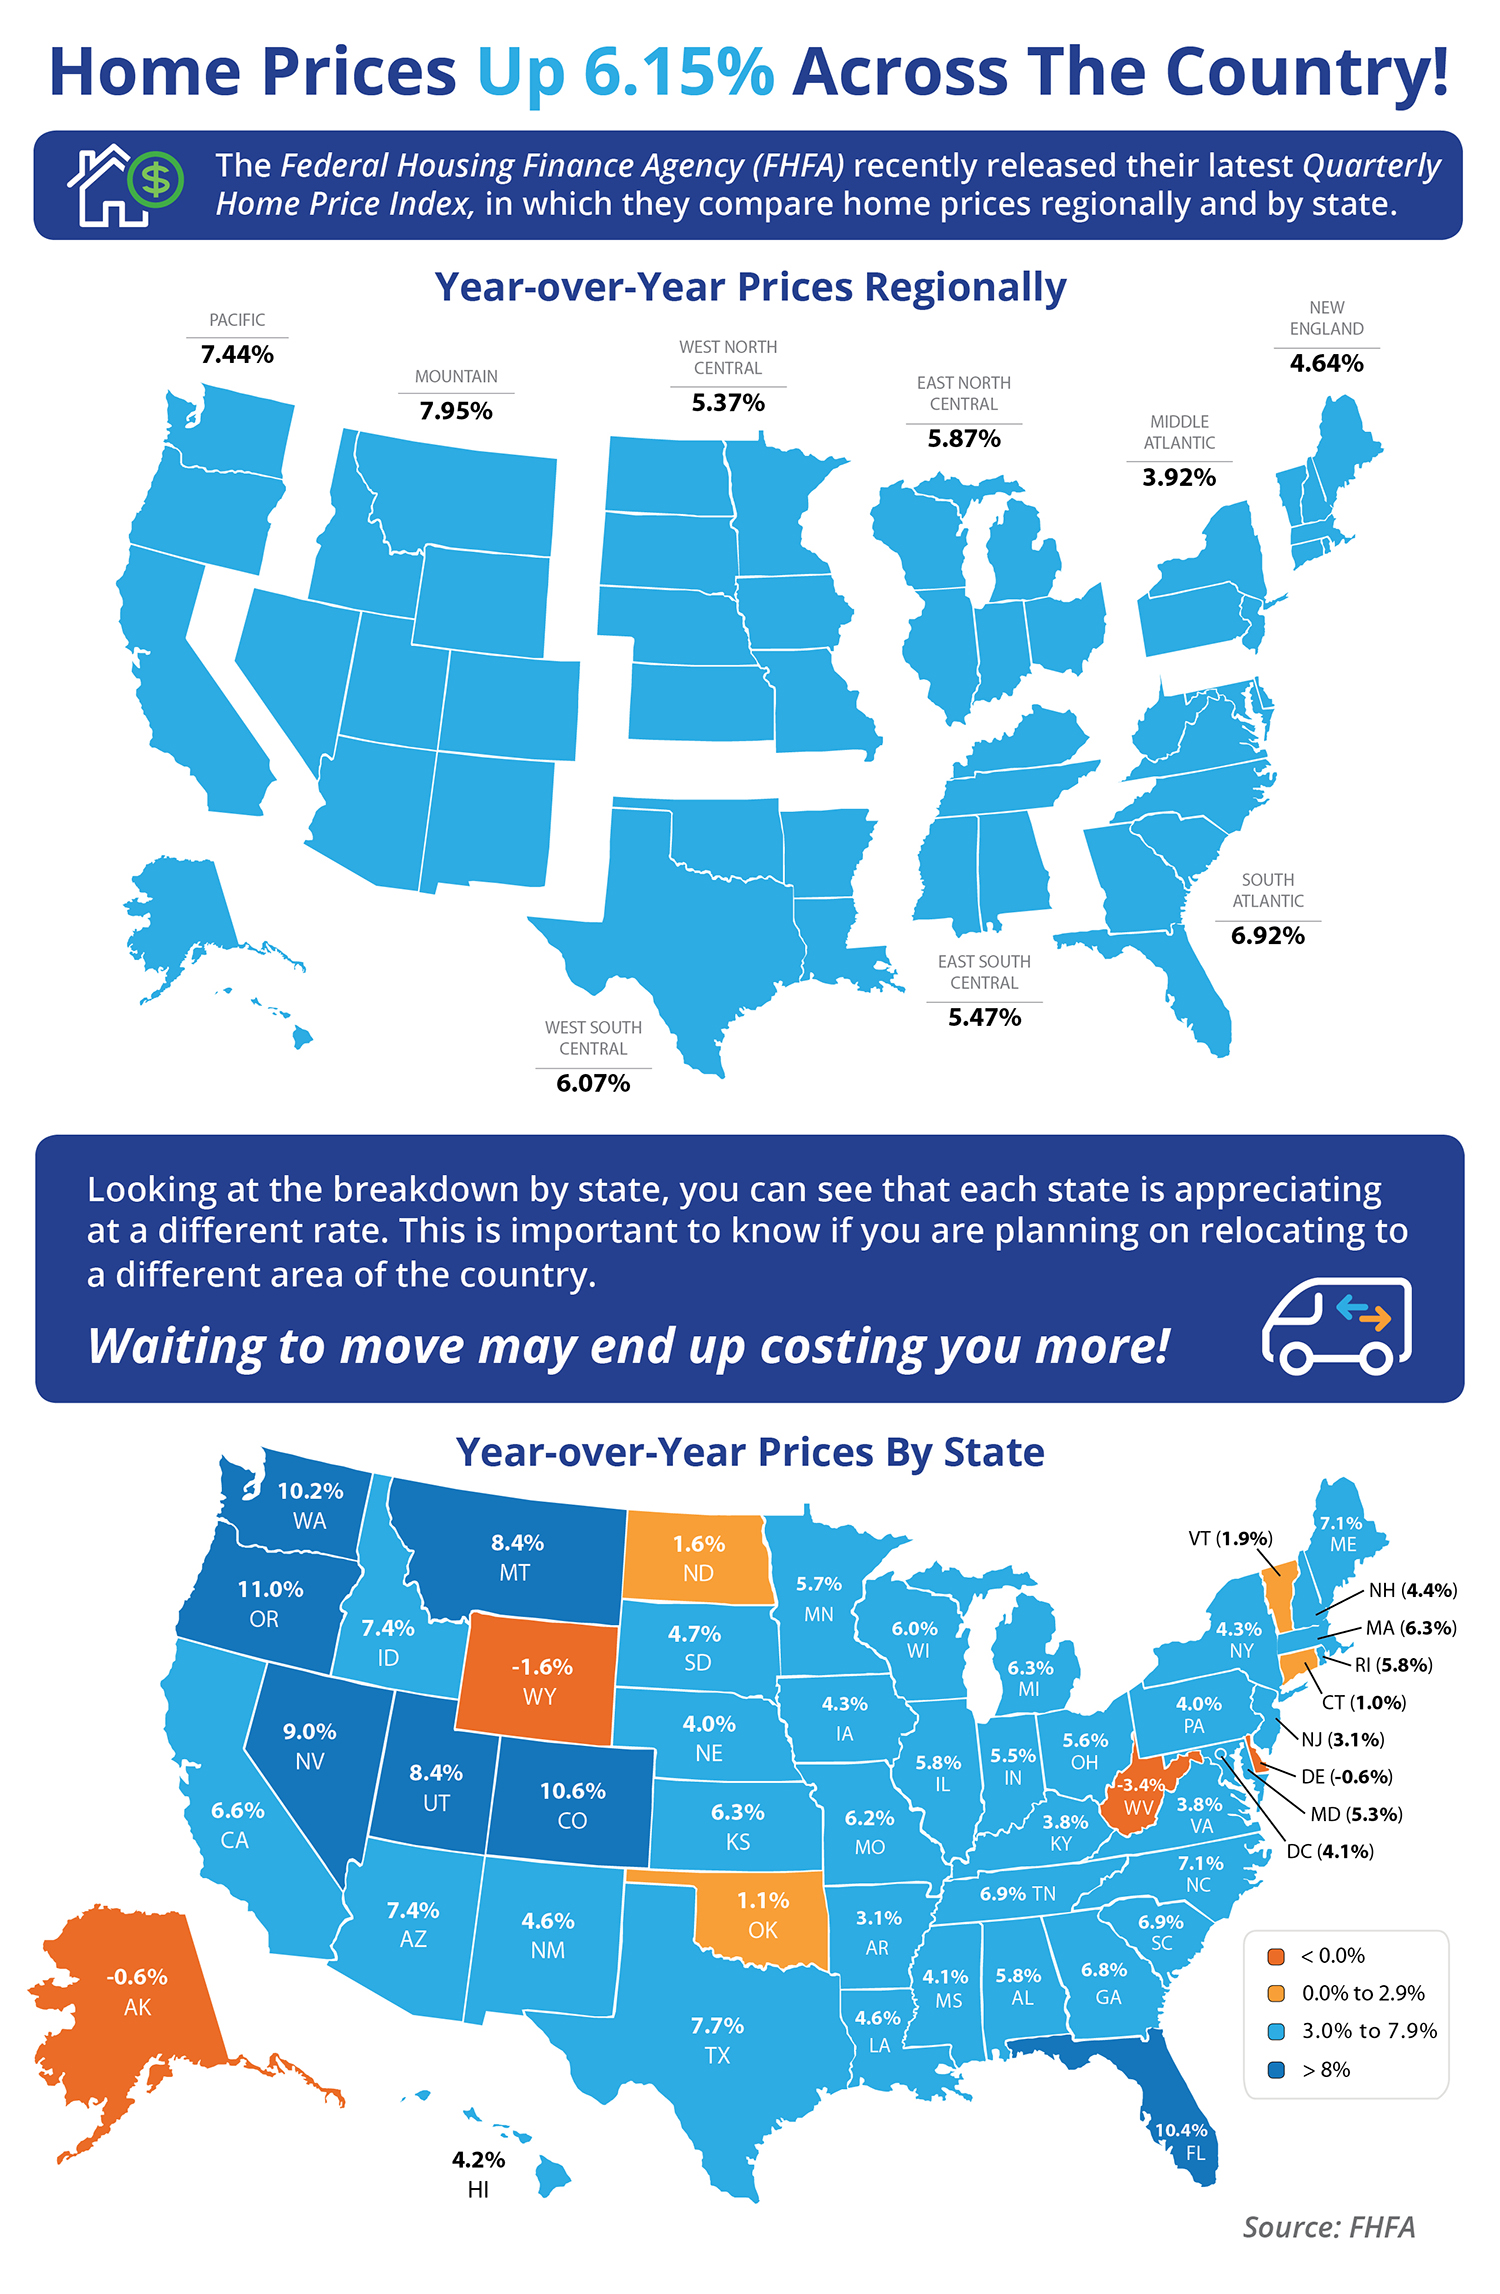
Home Prices Up 6.15% Across the Country! [INFOGRAPHIC]
Mar
31
2017
Some Highlights:
- The Federal Housing Finance Agency (FHFA) recently released their latest Quarterly Home Price Index report.
- In the report, home prices are compared both regionally and by state.
- Based on the latest numbers, if you plan on relocating to another state, waiting to move may end up costing you more!
- Alaska, Delaware, West Virginia & Wyoming were the only states where home prices are lower than they were last year.
Posted in First Time Home Buyers, For Buyers, For Sellers, Infographics, Move-Up Buyers, Pricing
Don’t Let Your Luck Run Out [INFOGRAPHIC]
Mar
17
2017
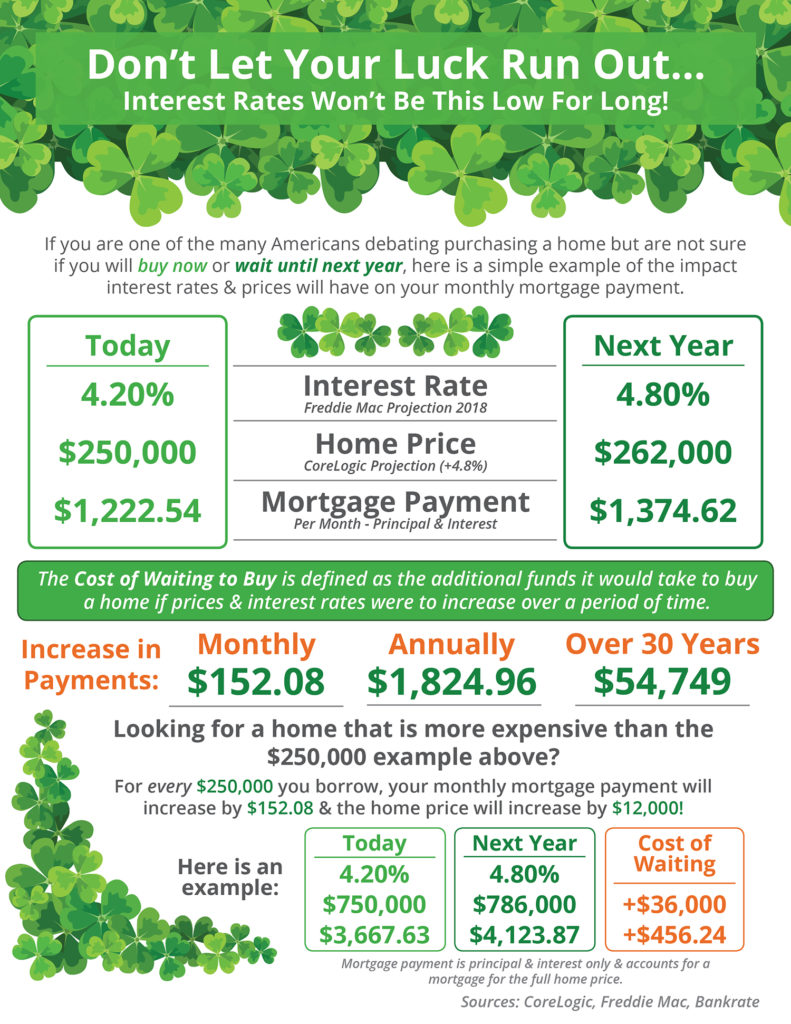
Some Highlights:
- The “Cost of Waiting to Buy” is defined as the additional funds it would take to buy a home if prices and interest rates were to increase over a period of time.
- Freddie Mac predicts that interest rates will increase to 4.8% by this time next year, while home prices are predicted to appreciate by 4.8% according to CoreLogic.
- Waiting until next year to buy could cost you thousands of dollars a year for the life of your mortgage!
Posted in First Time Home Buyers, For Buyers, Infographics, Interest Rates, Move-Up Buyers, Pricing
