Instant Home Estimate
For your home value estimate, enter the access code you received on the postcard, just click here:

Home sales numbers are leveling off, the rate of price appreciation has slowed to more historically normal averages, and inventory is finally increasing. We are headed into a more normal housing market.
However, some are seeing these adjustments as red flags and are suggesting that we are headed back to the same challenges we experienced in 2008. Today, let’s look at one set of statistics that prove the current market is nothing like the one that preceded the housing crash last decade.
The previous bubble was partially caused by unhealthy levels of mortgage debt. New purchasers were putting down the minimum down payment, resulting in them having little if any equity in their homes.
Existing homeowners were using their homes as ATMs by refinancing and swapping their equity for cash. When prices started to fall, many homeowners found themselves in a negative equity situation (where their mortgage was higher than the value of their home) so they walked away which caused prices to fall even further. When this happened, even more homeowners found themselves in negative equity situations which caused them to walk away as well, and so a vicious cycle formed.
Today, the equity situation is totally different. According to a new report from ATTOM Data Solutions more than 1-in-4 homes with a mortgage have at least 50% equity. The report explains:
“…nearly 14.5 million U.S. properties were equity rich — where the combined estimated amount of loans secured by the property was 50 percent or less of the property’s estimated market value…The 14.5 million equity rich properties in Q3 2018 represented 25.7 percent of all properties with a mortgage.”
In addition, according to the U.S. Census Bureau, 30.3% of homes in the country have no mortgage on them.
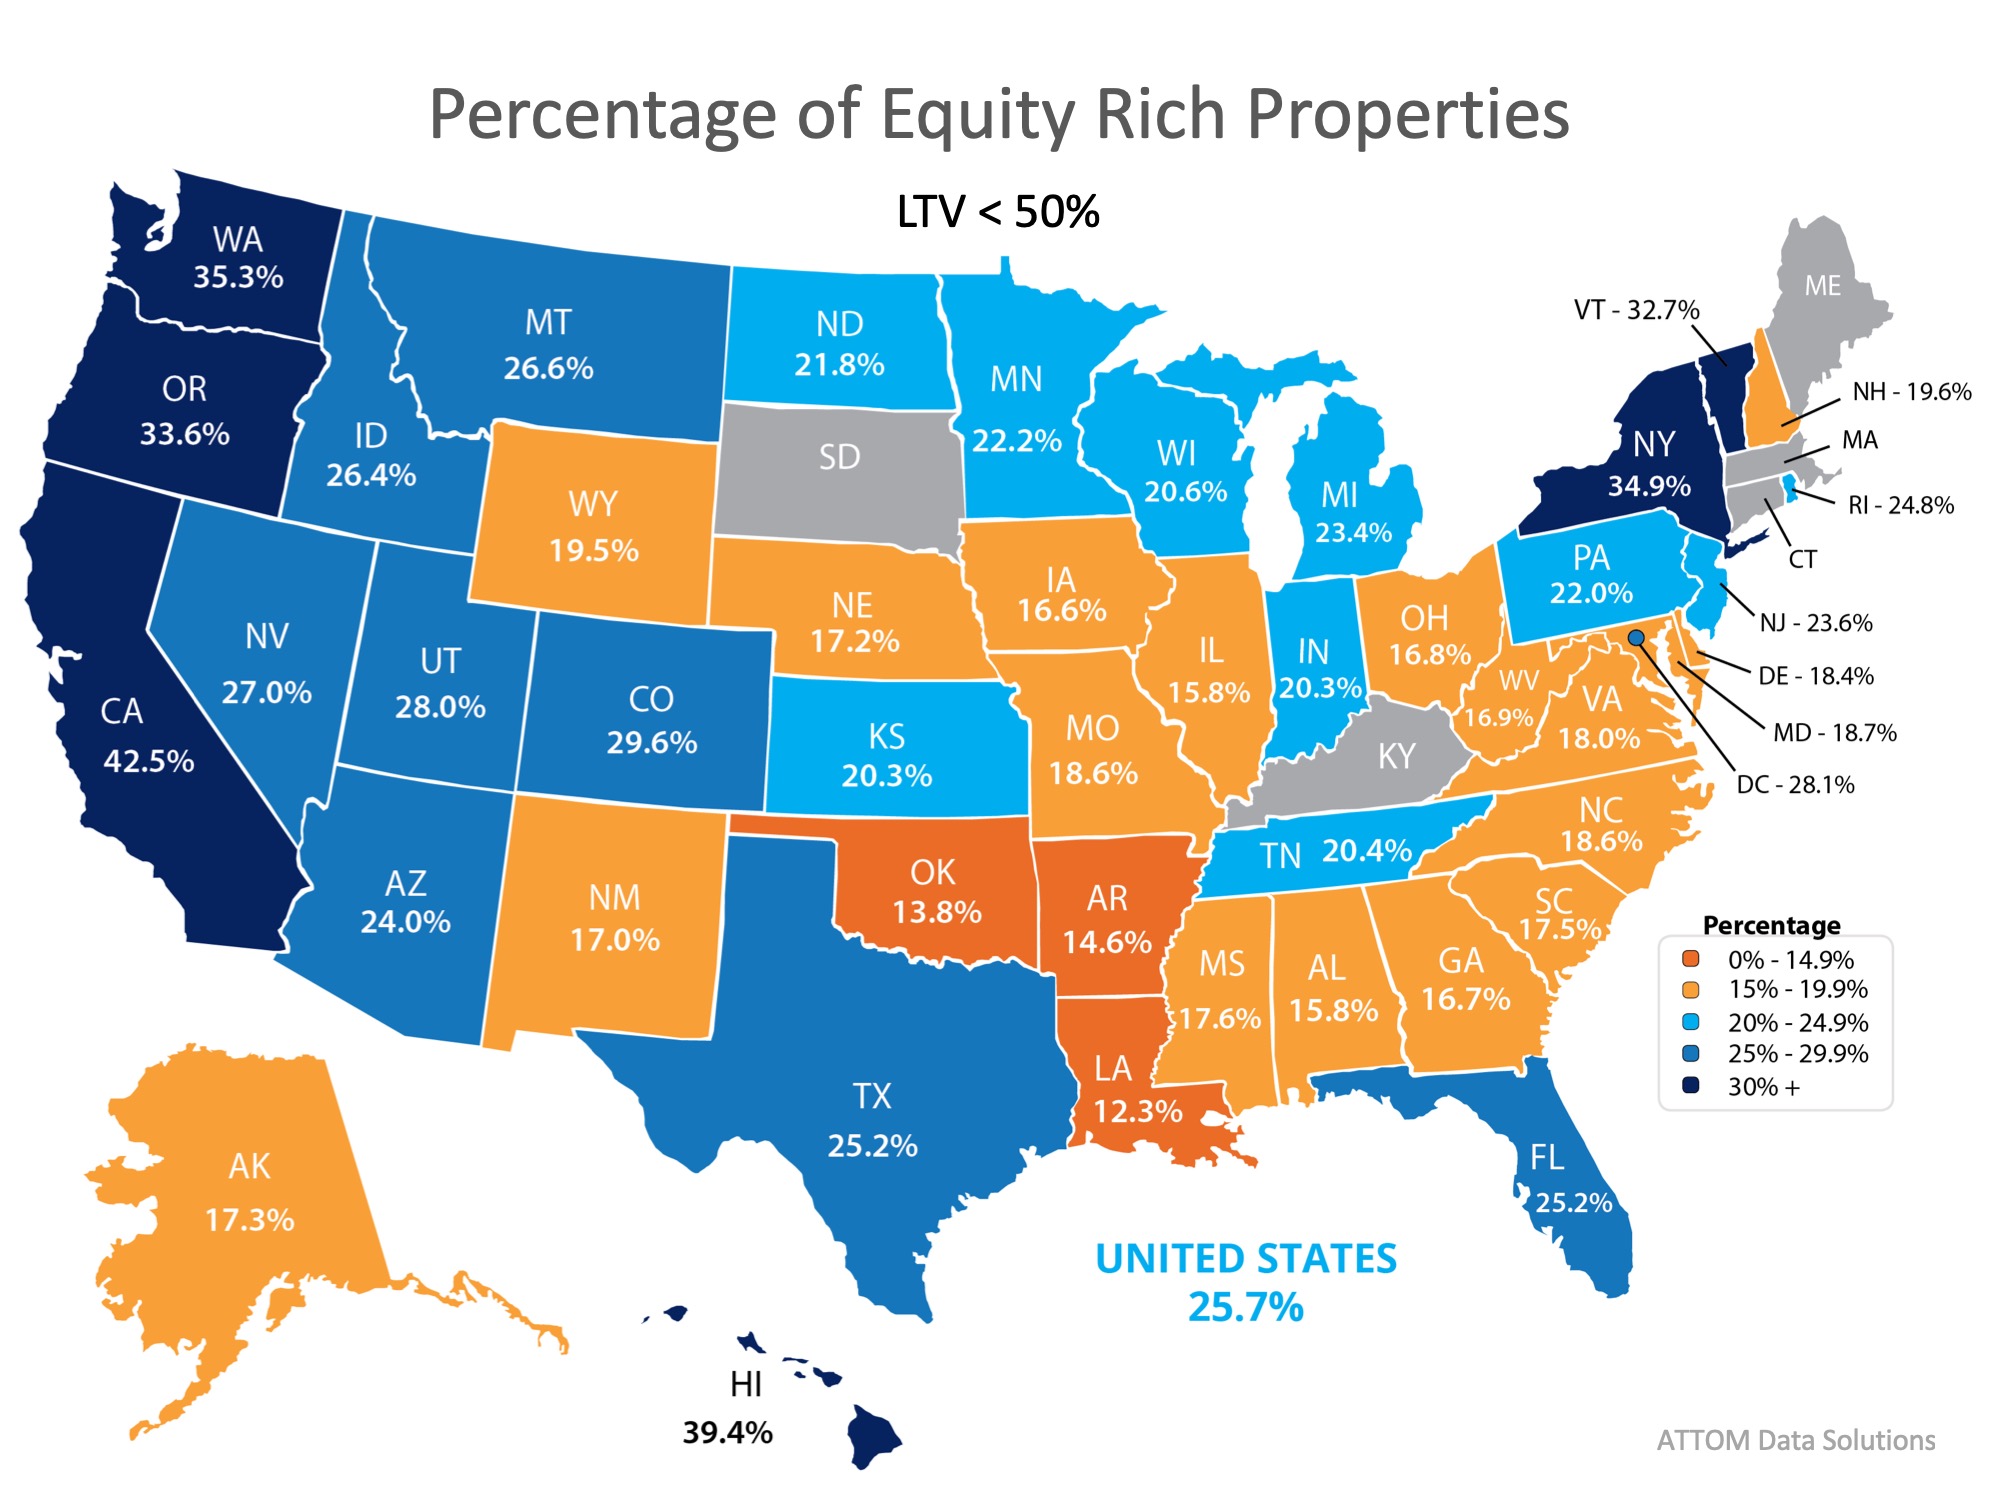
If we take both numbers, the 30.3% of all homes without a mortgage and the 17.9% with at least 50% equity (25.7% of the 69.3% of homes with a mortgage), we realize that 48.2% of all homes in the country have at least 50% equity.
Unlike 2008, almost half of the homeowners in the country are sitting on massive amounts of home equity. They will not be walking away from their homes if the housing market begins to soften.
Posted in For Buyers, For Sellers, Housing Market Updates

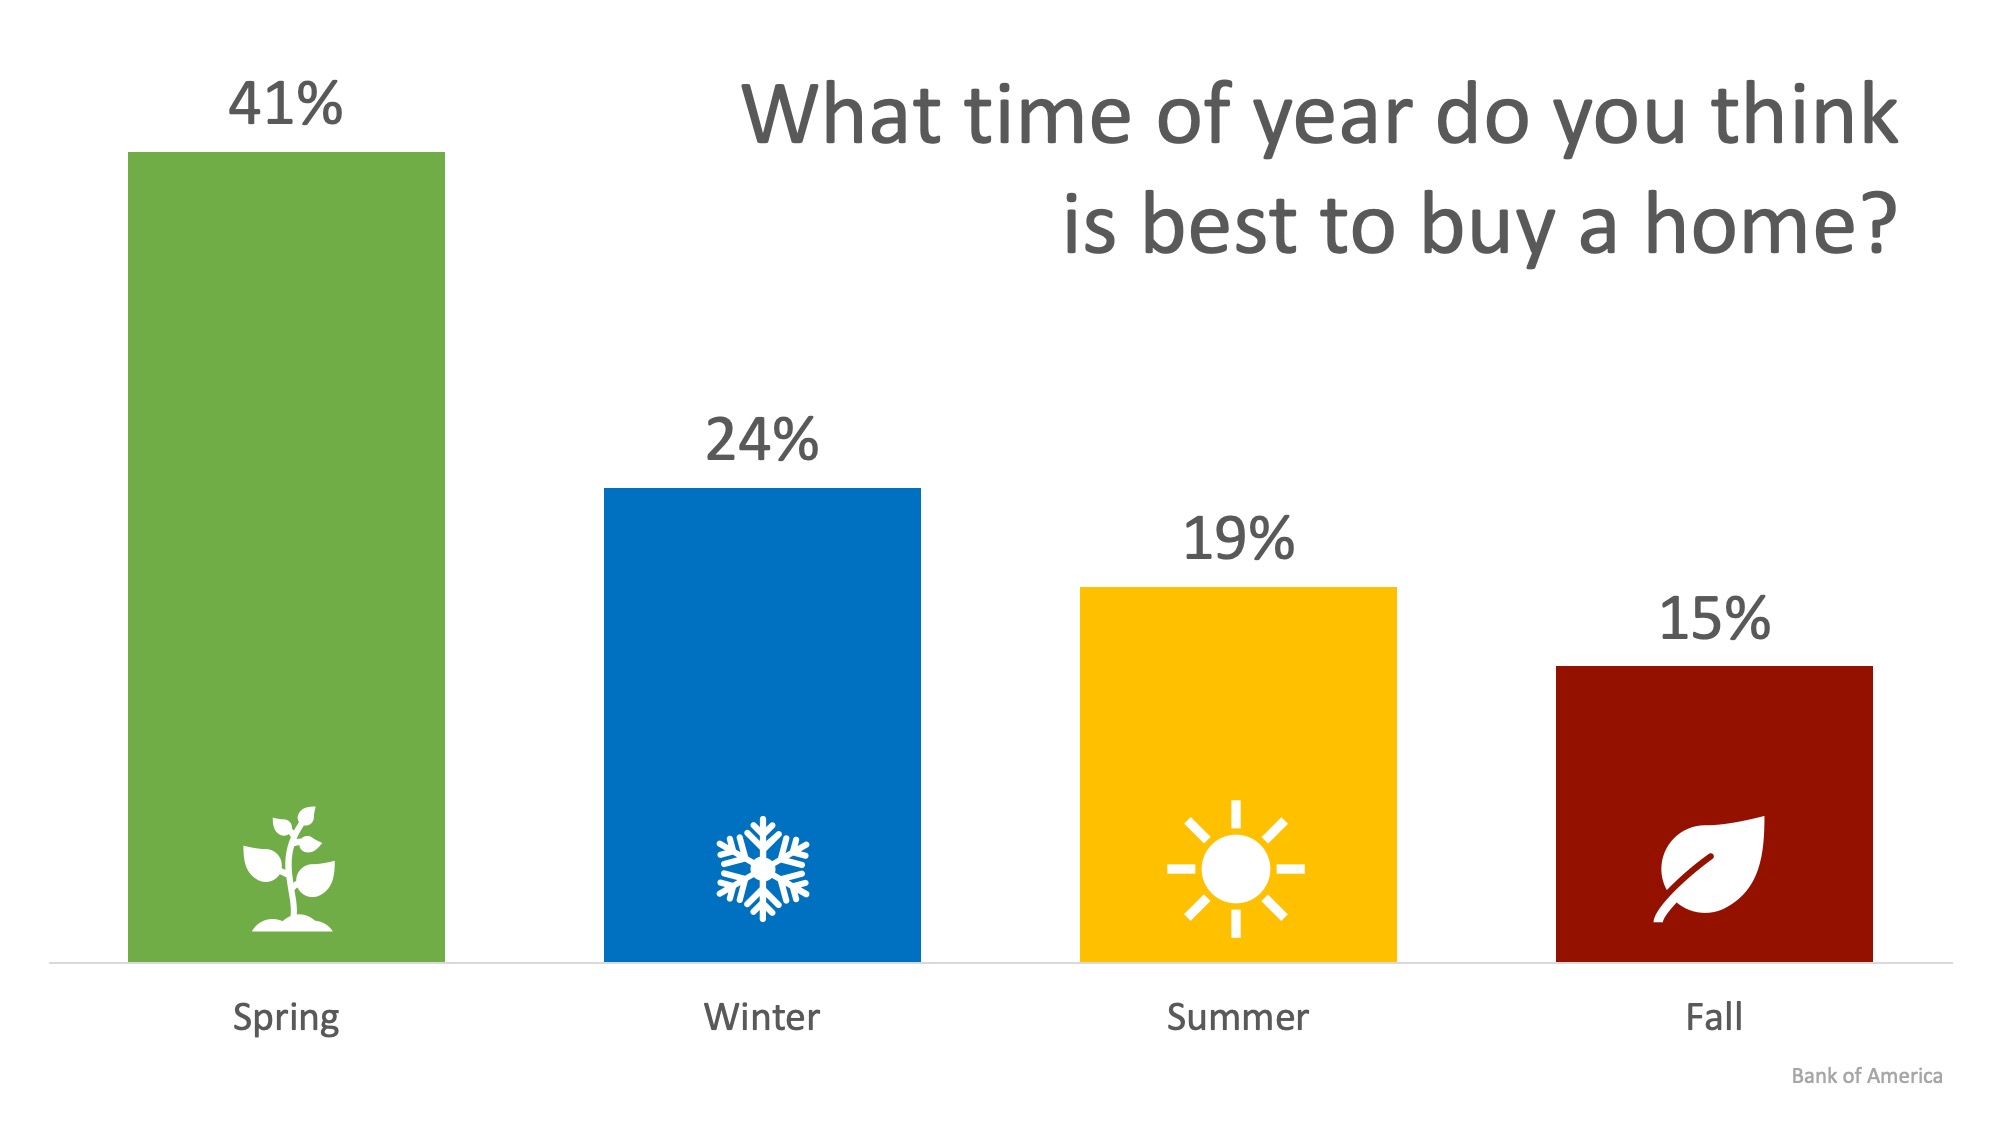
In real estate, the spring is often seen as the ideal time to buy or sell a house. The term “Spring Buyer’s Season” exists for a reason, as renters and those looking to move on from their current home thaw out from the winter and hit the market ready to buy.
According to Bank of America’s annual Home Buyer Insights Report, 41% of renters surveyed agree that spring is the best time to buy a home. The surprising result, however, is that when ranking the seasons, winter comes in second at 24%.
In many areas of the country, the spring and summer are the most competitive seasons for buyers. Families with children often want to move over the summer to make sure that their kids are ready for school in the fall. This often leads those families who haven’t found homes to buy to push pause on their search in the fall and winter months.
This creates a great environment for buyers to find a home with less competition. According to moving.com, scheduling a move during the winter months also comes with the best price.
“If you define ‘best’ by cost then, generally speaking, you are more likely to save on a move during the late September to April window. Demand for movers usually slows down during this time frame and rates are low.”
There are also many benefits to listing your house for sale during the winter months as well!
As we recently mentioned, buyers who are out in the winter are serious about wanting to find a home, and there is traditionally less competition on the market which gives you greater exposure to those buyers.
As always, the best time to buy or move all depends on each individual buyer or seller’s goals and needs. If you are one of the many who would like to make a move this winter, let’s get together to create a plan to make it happen!
Posted in For Buyers, For Sellers, Housing Market Updates

Many sellers believe that spring is the best time to place their homes on the market because buyer demand traditionally increases at that time of year, but what they don’t realize is that if every homeowner believes the same thing, then that is when they will have the most competition!
Housing supply traditionally shrinks at this time of year, so the choices buyers have will be limited. The chart below was created using the months’ supply of listings from the National Association of Realtors.
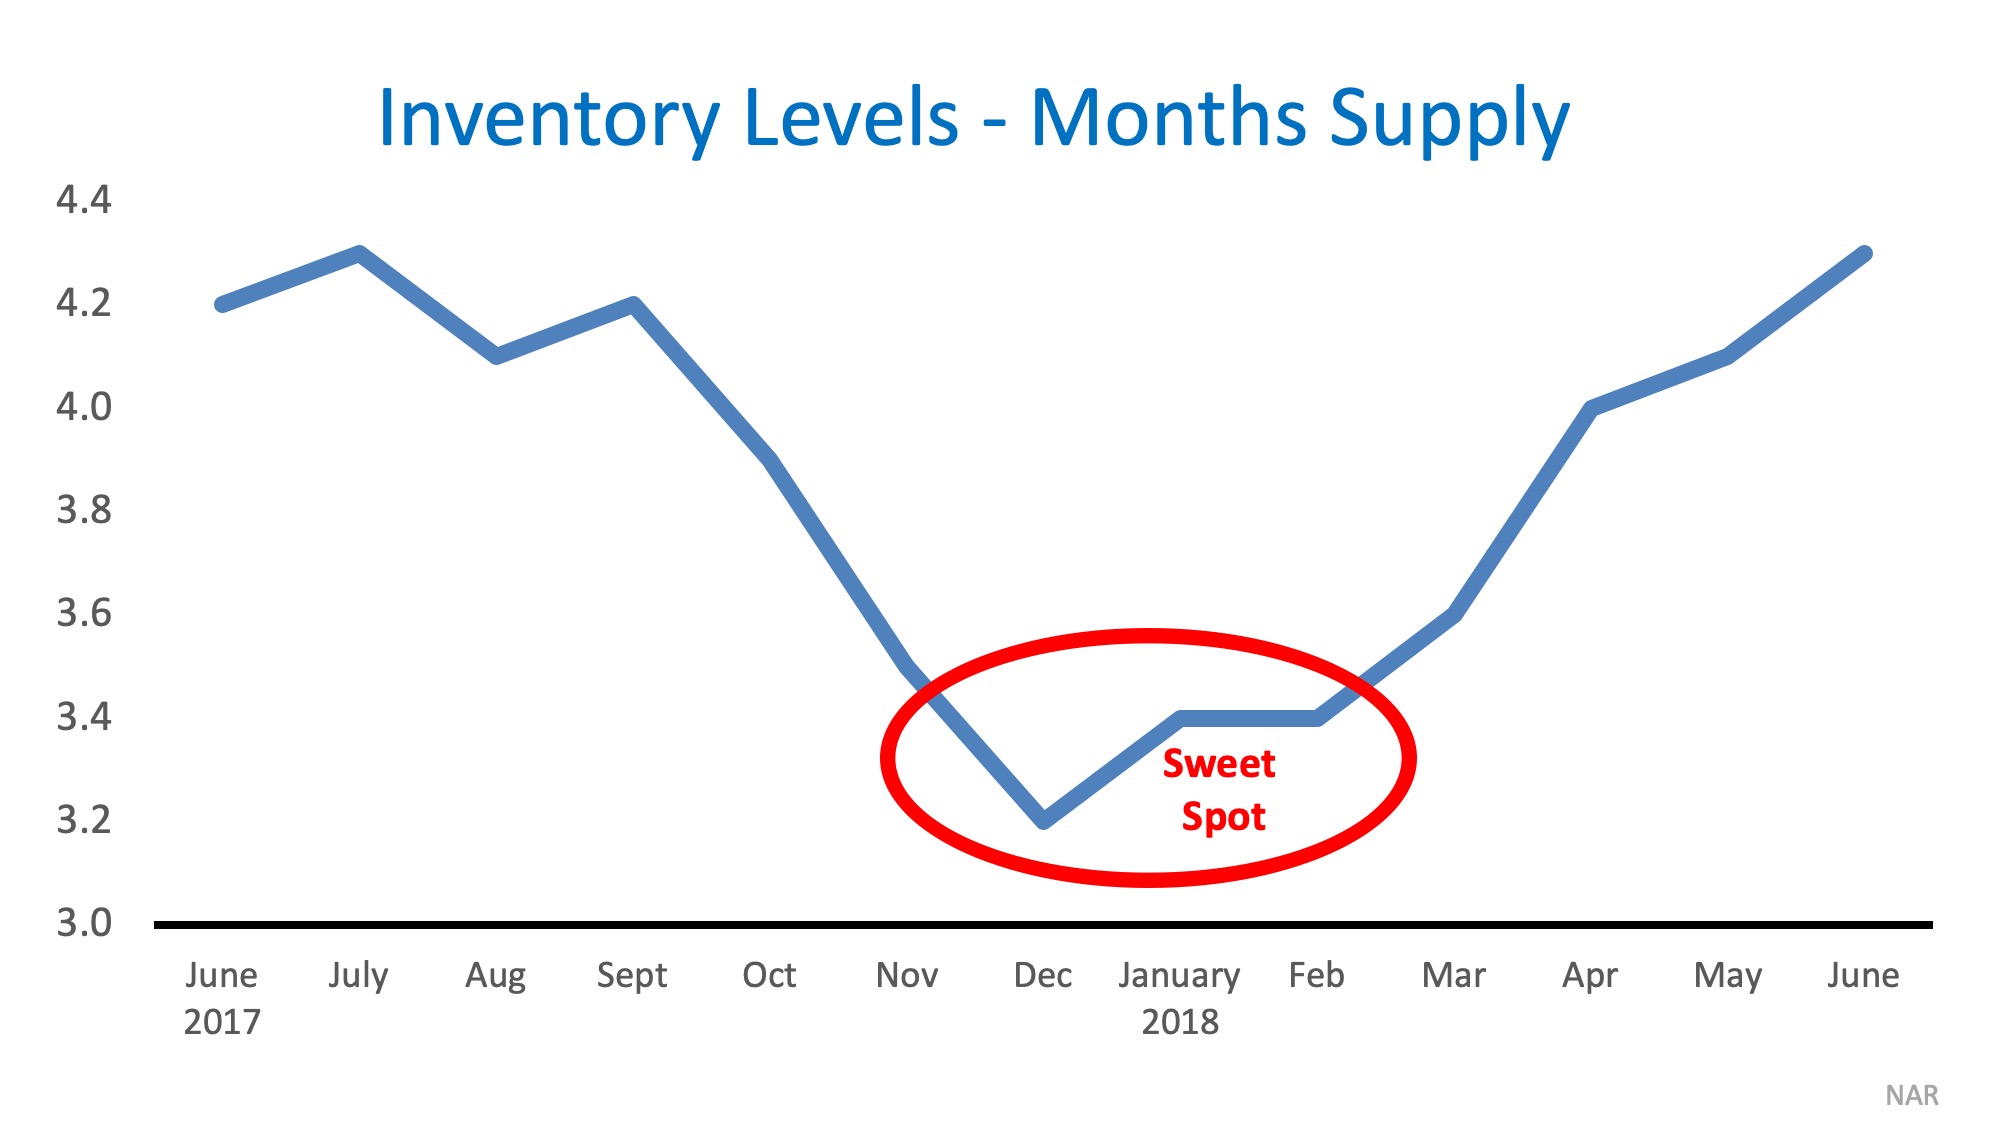
As you can see, the ‘sweet spot’ to list your home for the most exposure naturally occurs in the late fall and winter months (November – February).
Temperatures aren’t the only thing that heats up in the spring – so do listings!
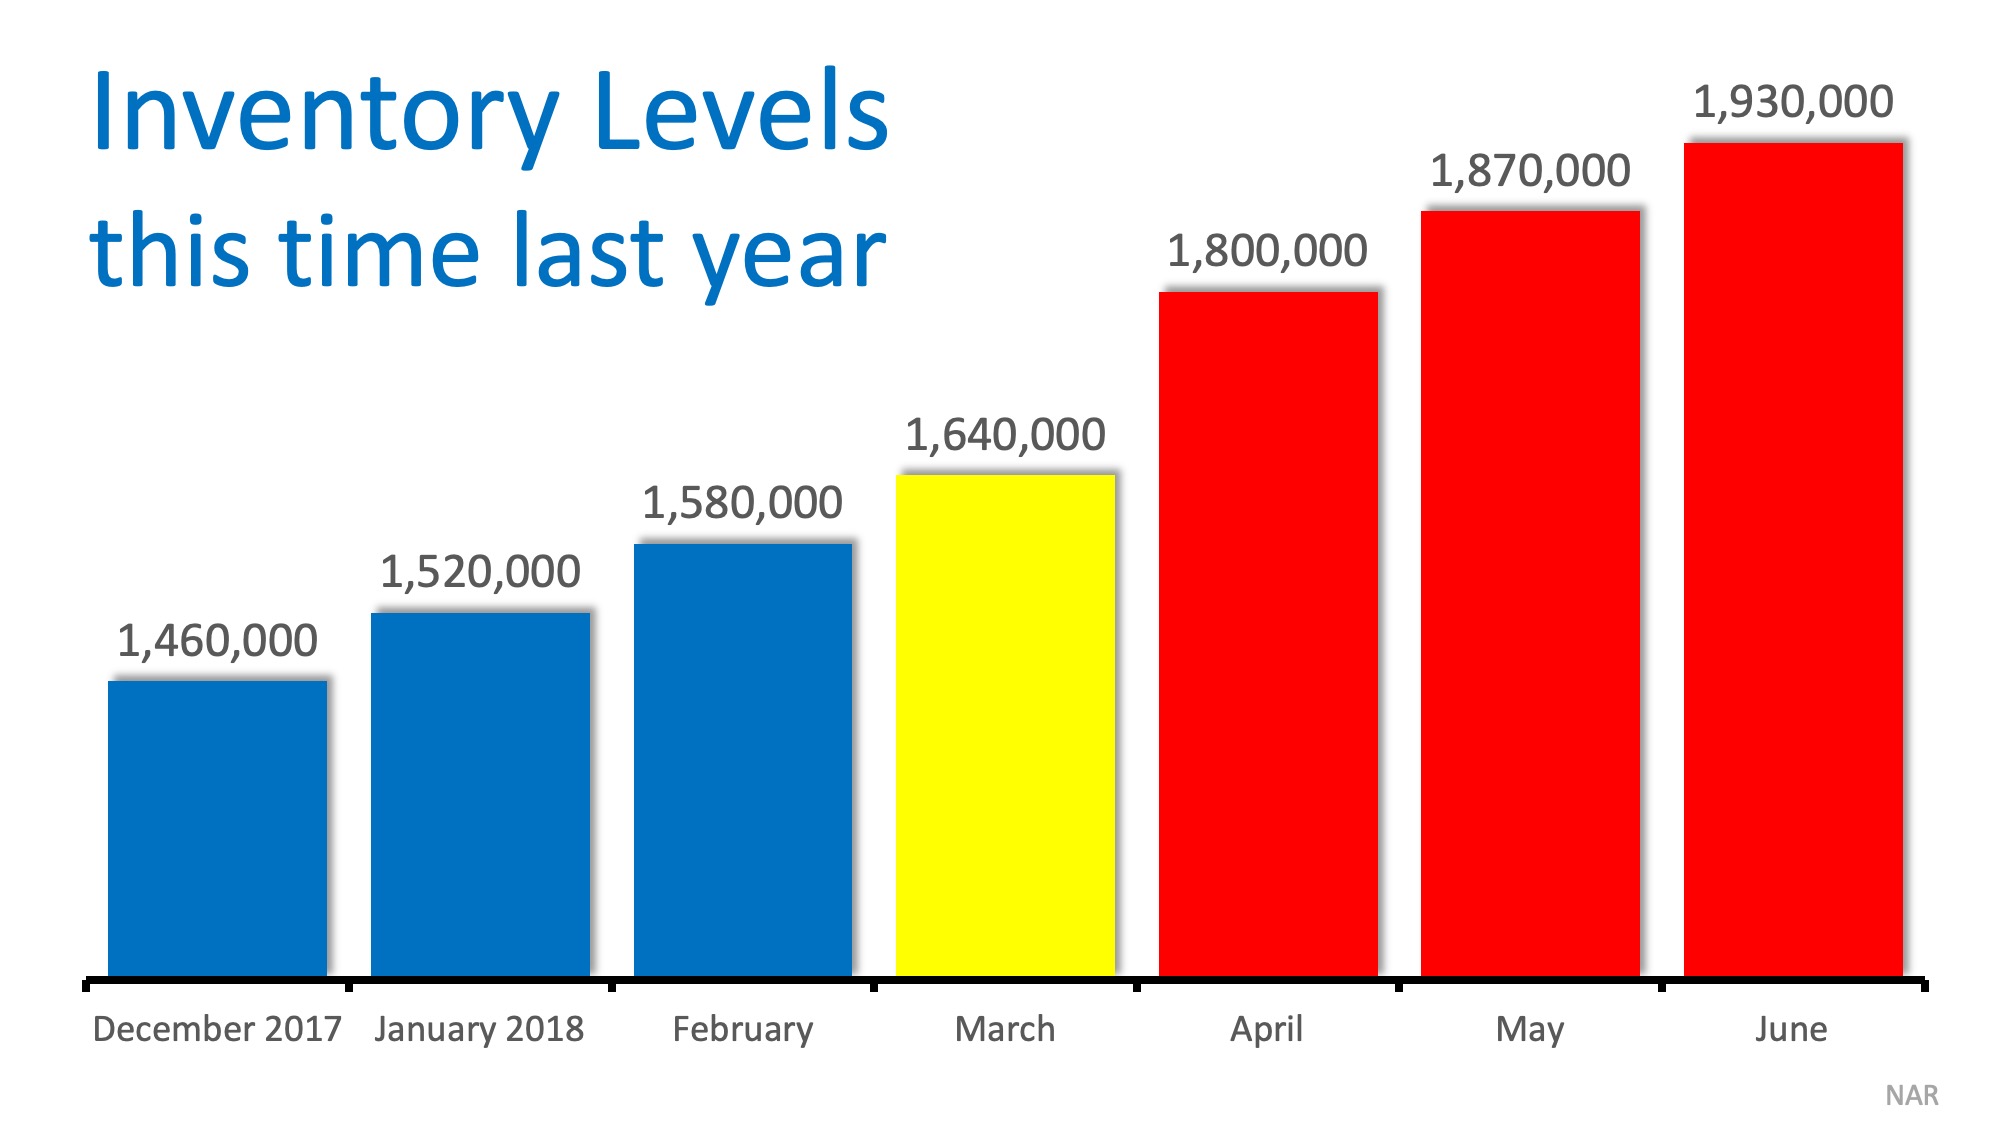
In 2017, listings increased by nearly half a million houses from December to June. Don’t wait for these listings to come to market before you decide to list your house.
At this time of year, only those purchasers who are serious about buying a home will be in the marketplace. You and your family will not be bothered and inconvenienced by mere ‘lookers.’ The lookers are at the mall or online doing their holiday shopping.
If you have been debating whether or not to sell your home and are curious about market conditions in your area, let’s get together to help you decide the best time to list your house for sale.
Posted in For Sellers, Move-Up Buyers, Selling Myths
![Existing Home Sales Slowed by a Lack of Listings [INFOGRAPHIC] | Simplifying The Market](https://files.simplifyingthemarket.com/wp-content/uploads/2018/11/21112153/20181122-Share-STM1.jpg)
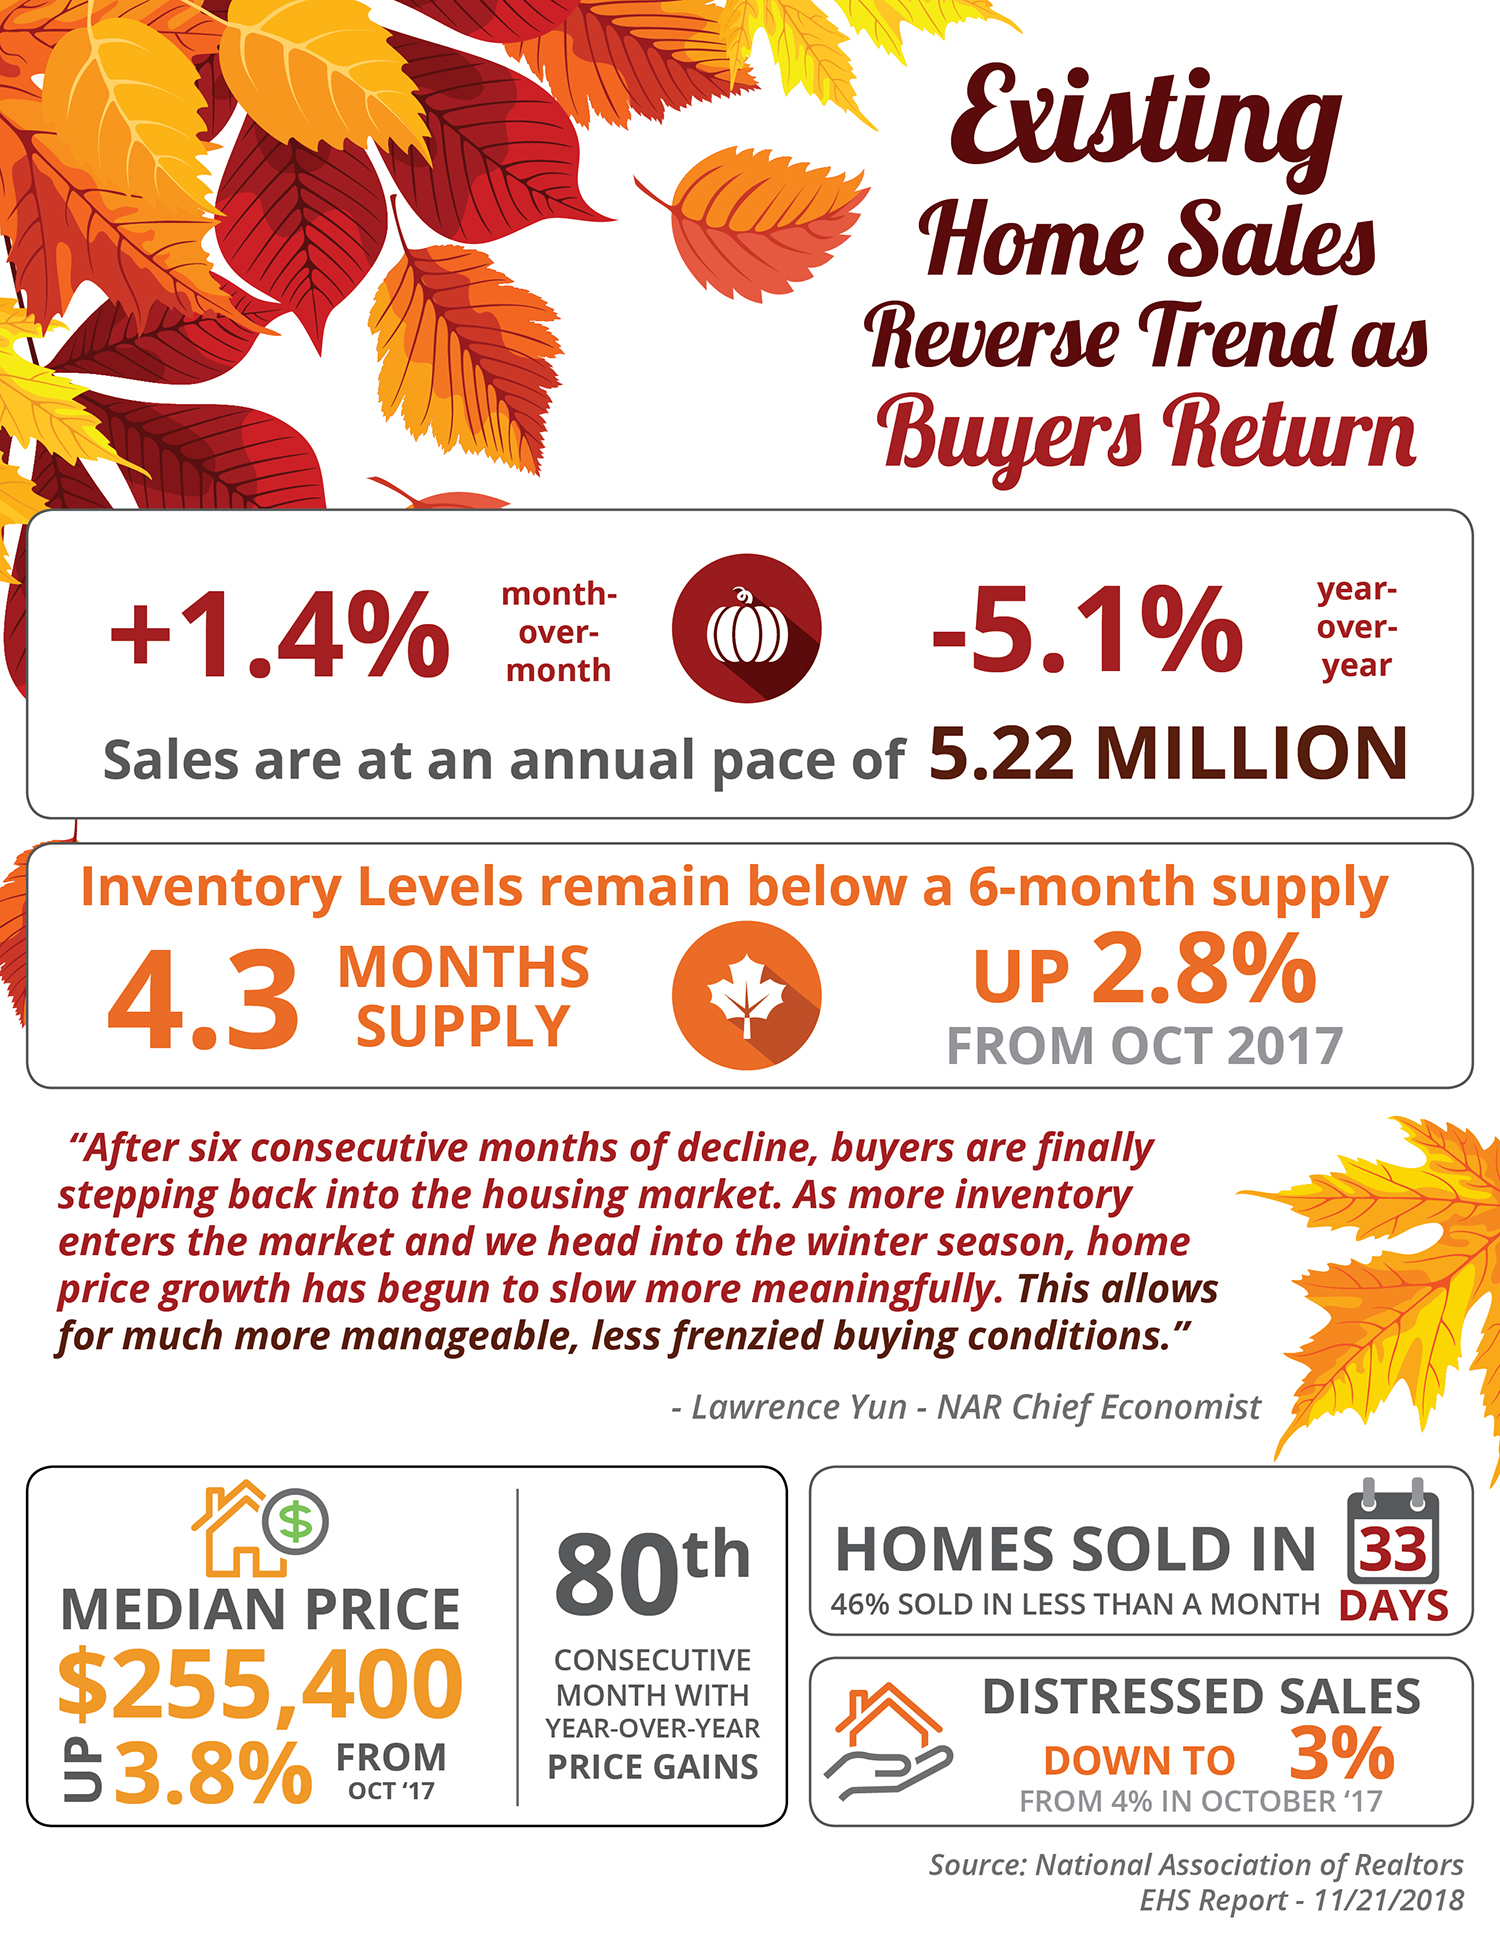
Posted in For Buyers, For Sellers, Housing Market Updates, Infographics

With home prices on the rise and buyer demand still strong, some sellers may be tempted to try and sell their homes on their own without using the services of a real estate professional.
Real estate agents are trained and experienced in negotiation and, in most cases, the seller is not. Sellers must realize that their ability to negotiate will determine whether or not they get the best deal for themselves and their families.
The percentage of sellers who have hired real estate agents to sell their homes has increased steadily over the last 20 years. Let’s get together to discuss all that we can do to make the process easier for you.
Posted in For Sellers, FSBOs, Move-Up Buyers

There are many unsubstantiated theories about what is happening with home prices. From those who are worried that prices are falling (data shows this is untrue), to those who are concerned that prices are again approaching boom peaks because of “irrational exuberance” (this is also untrue as prices are not at peak levels when they are adjusted for inflation), there seems to be no shortage of opinion.
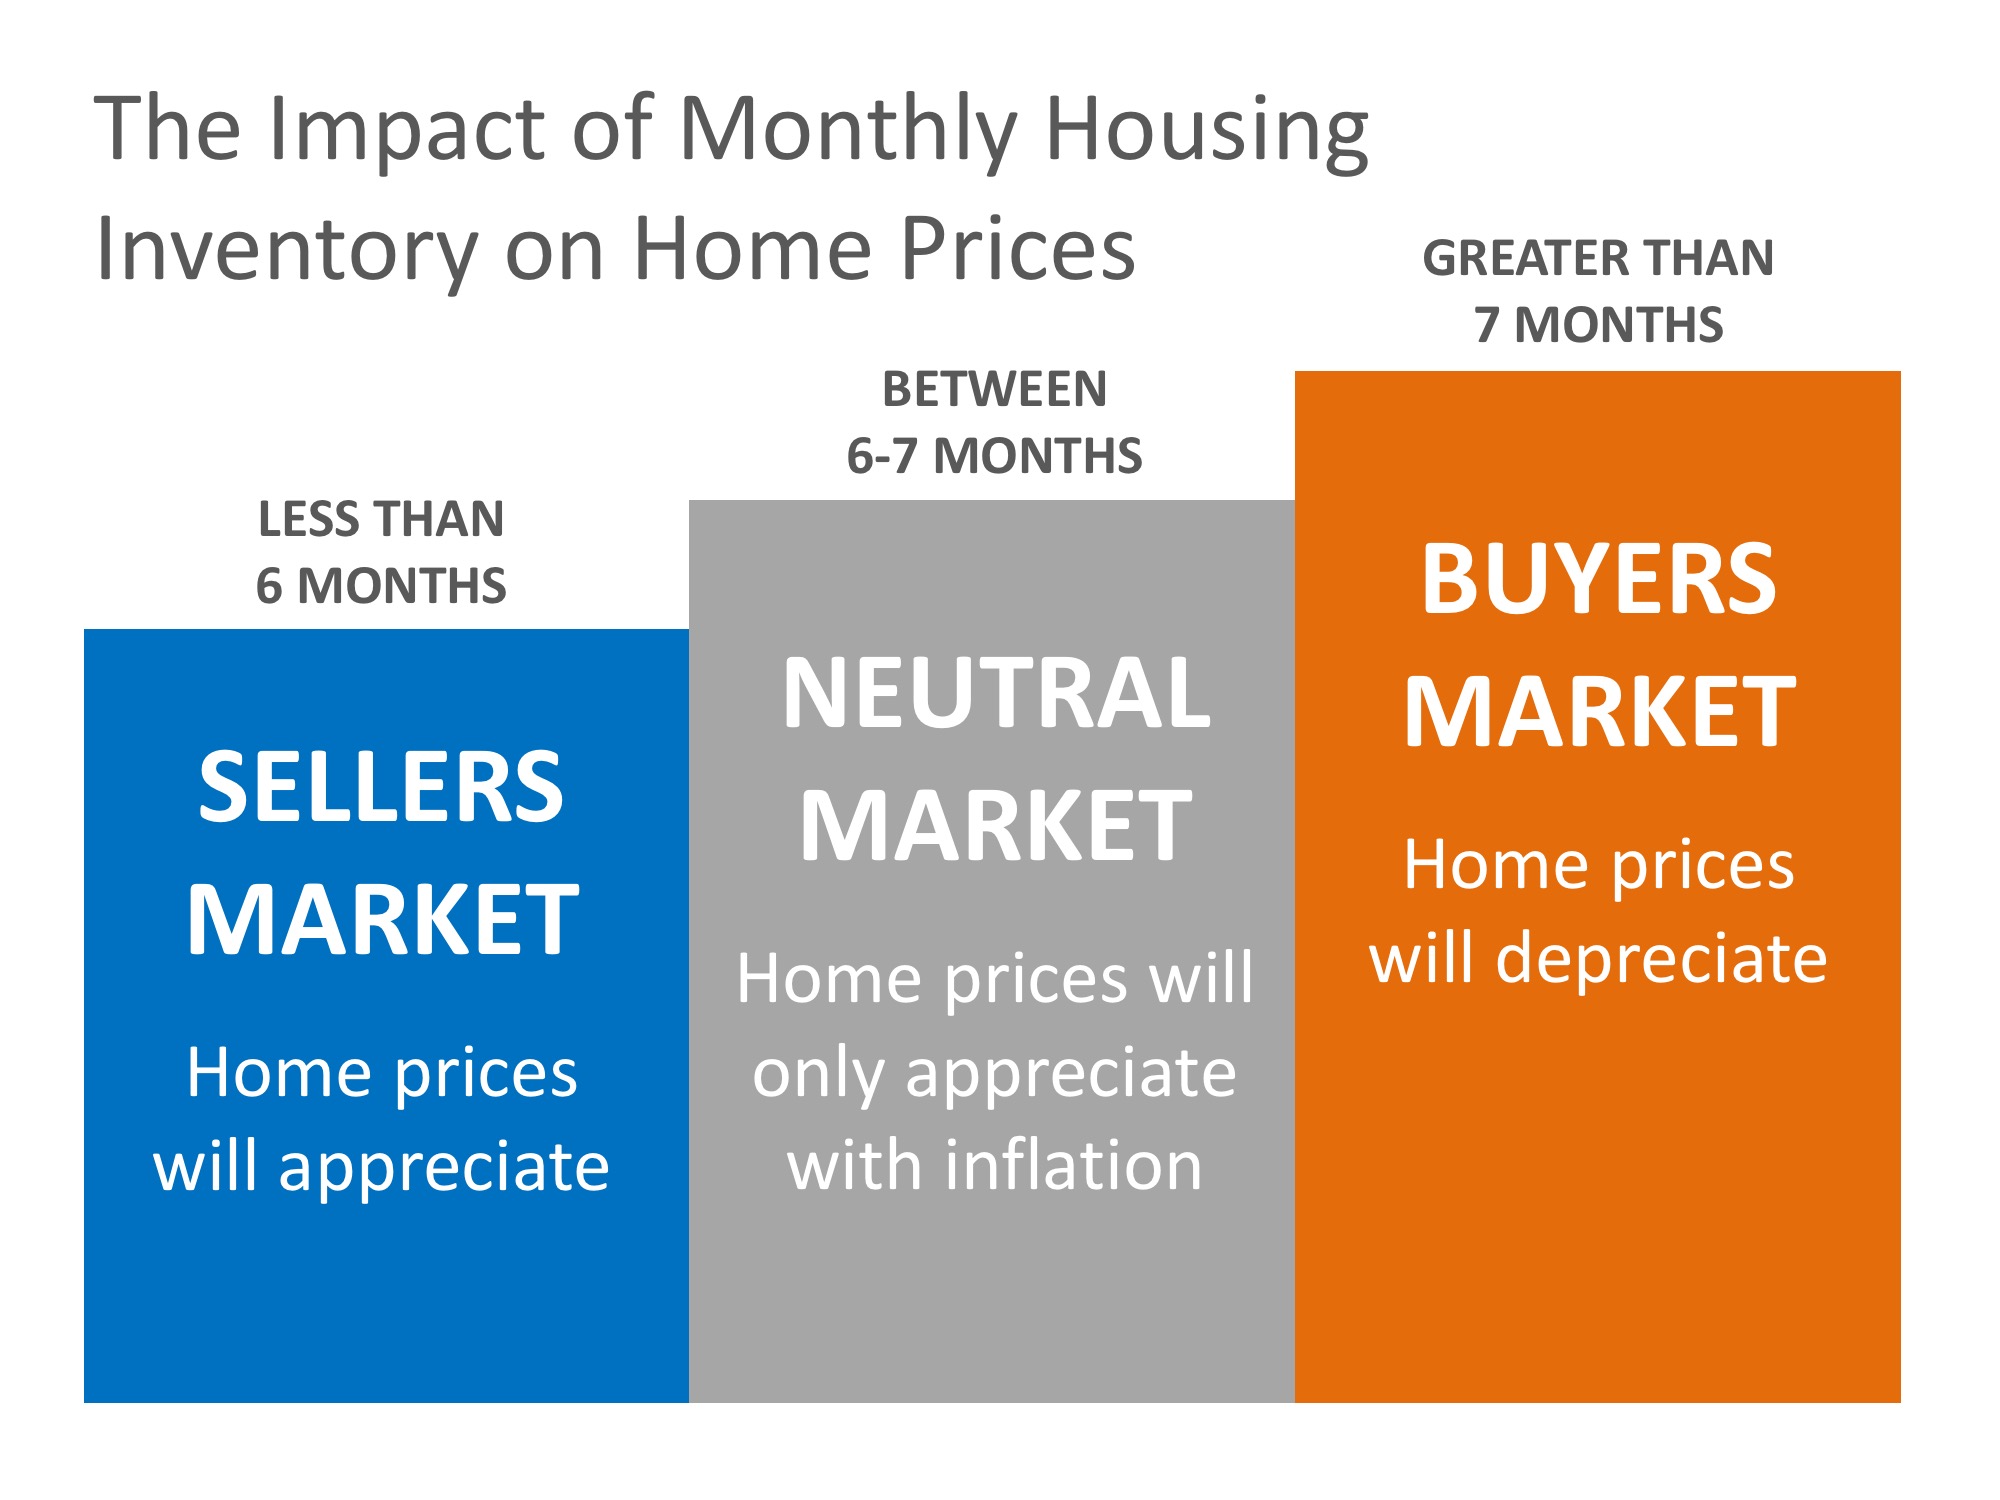
However, the increase in prices is easily explained by the theory of supply & demand. Whenever there is a limited supply of an item that is in high demand, prices increase. It is that simple. In real estate, it takes a six-month supply of existing salable inventory to maintain pricing stability. In most housing markets, anything less than six months will cause home values to appreciate and anything greater than seven months will cause prices to depreciate (see chart below).
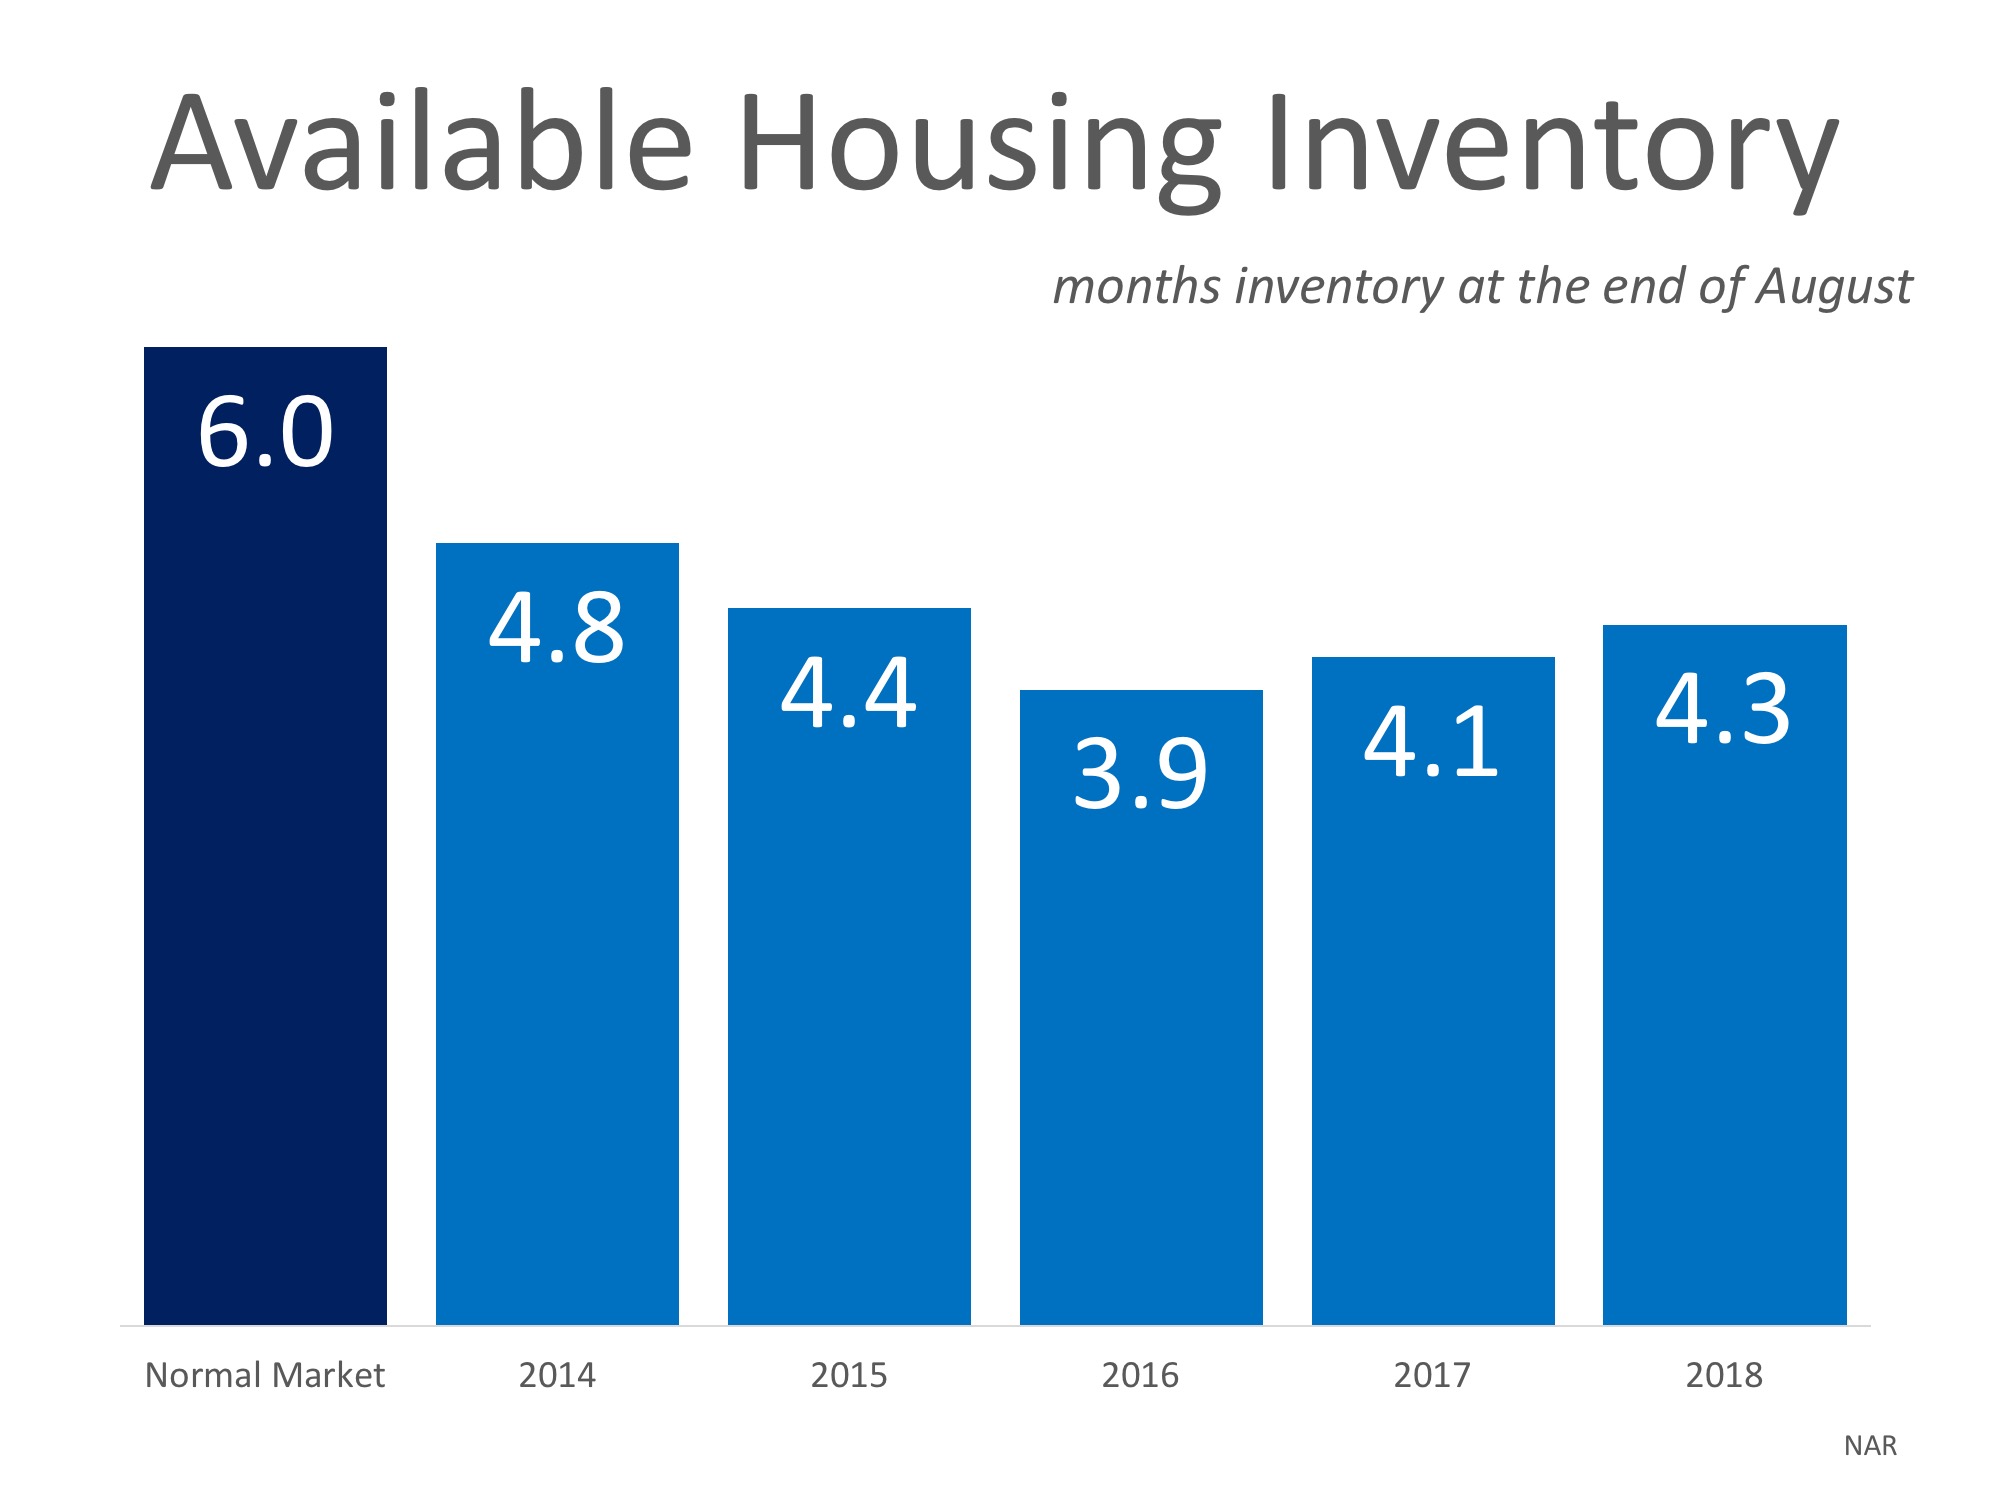
According to the Existing Home Sales Report from the National Association of Realtors (NAR), the monthly inventory of homes for sale has been below six months for the last five years (see chart below).
If buyer demand continues to outpace the current supply of existing homes for sale, prices will continue to appreciate. Nothing nefarious is taking place. It is simply the theory of supply & demand working as it should.
Posted in Buying Myths, First Time Home Buyers, For Buyers, For Sellers, Housing Market Updates, Move-Up Buyers, Pricing
![20 Tips for Preparing Your House for Sale This Fall [INFOGRAPHIC] | Simplifying The Market](https://files.simplifyingthemarket.com/wp-content/uploads/2018/10/11103717/20181019-Share-STM.jpg)

Posted in For Sellers, Infographics

When it comes to buying or selling a home there are many factors you should consider. Where you want to live, why you want to buy or sell, and who will help you along your journey are just some of those factors. When it comes to today’s real estate market, though, the top two factors to consider are what’s happening with interest rates & inventory.
Mortgage interest rates have been on the rise and are now over three-quarters of a percentage point higher than they were at the beginning of the year. According to Freddie Mac’s latest Primary Mortgage Market Survey, rates climbed to 4.72% for a 30-year fixed rate mortgage last week.
The interest rate you secure when buying a home not only greatly impacts your monthly housing costs, but also impacts your purchasing power.
Purchasing power, simply put, is the amount of home you can afford to buy for the budget you have available to spend. As rates increase, the price of the house you can afford to buy will decrease if you plan to stay within a certain monthly housing budget.
The chart below shows the impact that rising interest rates would have if you planned to purchase a $400,000 home while keeping your principal and interest payments between $2,020-$2,050 a month.
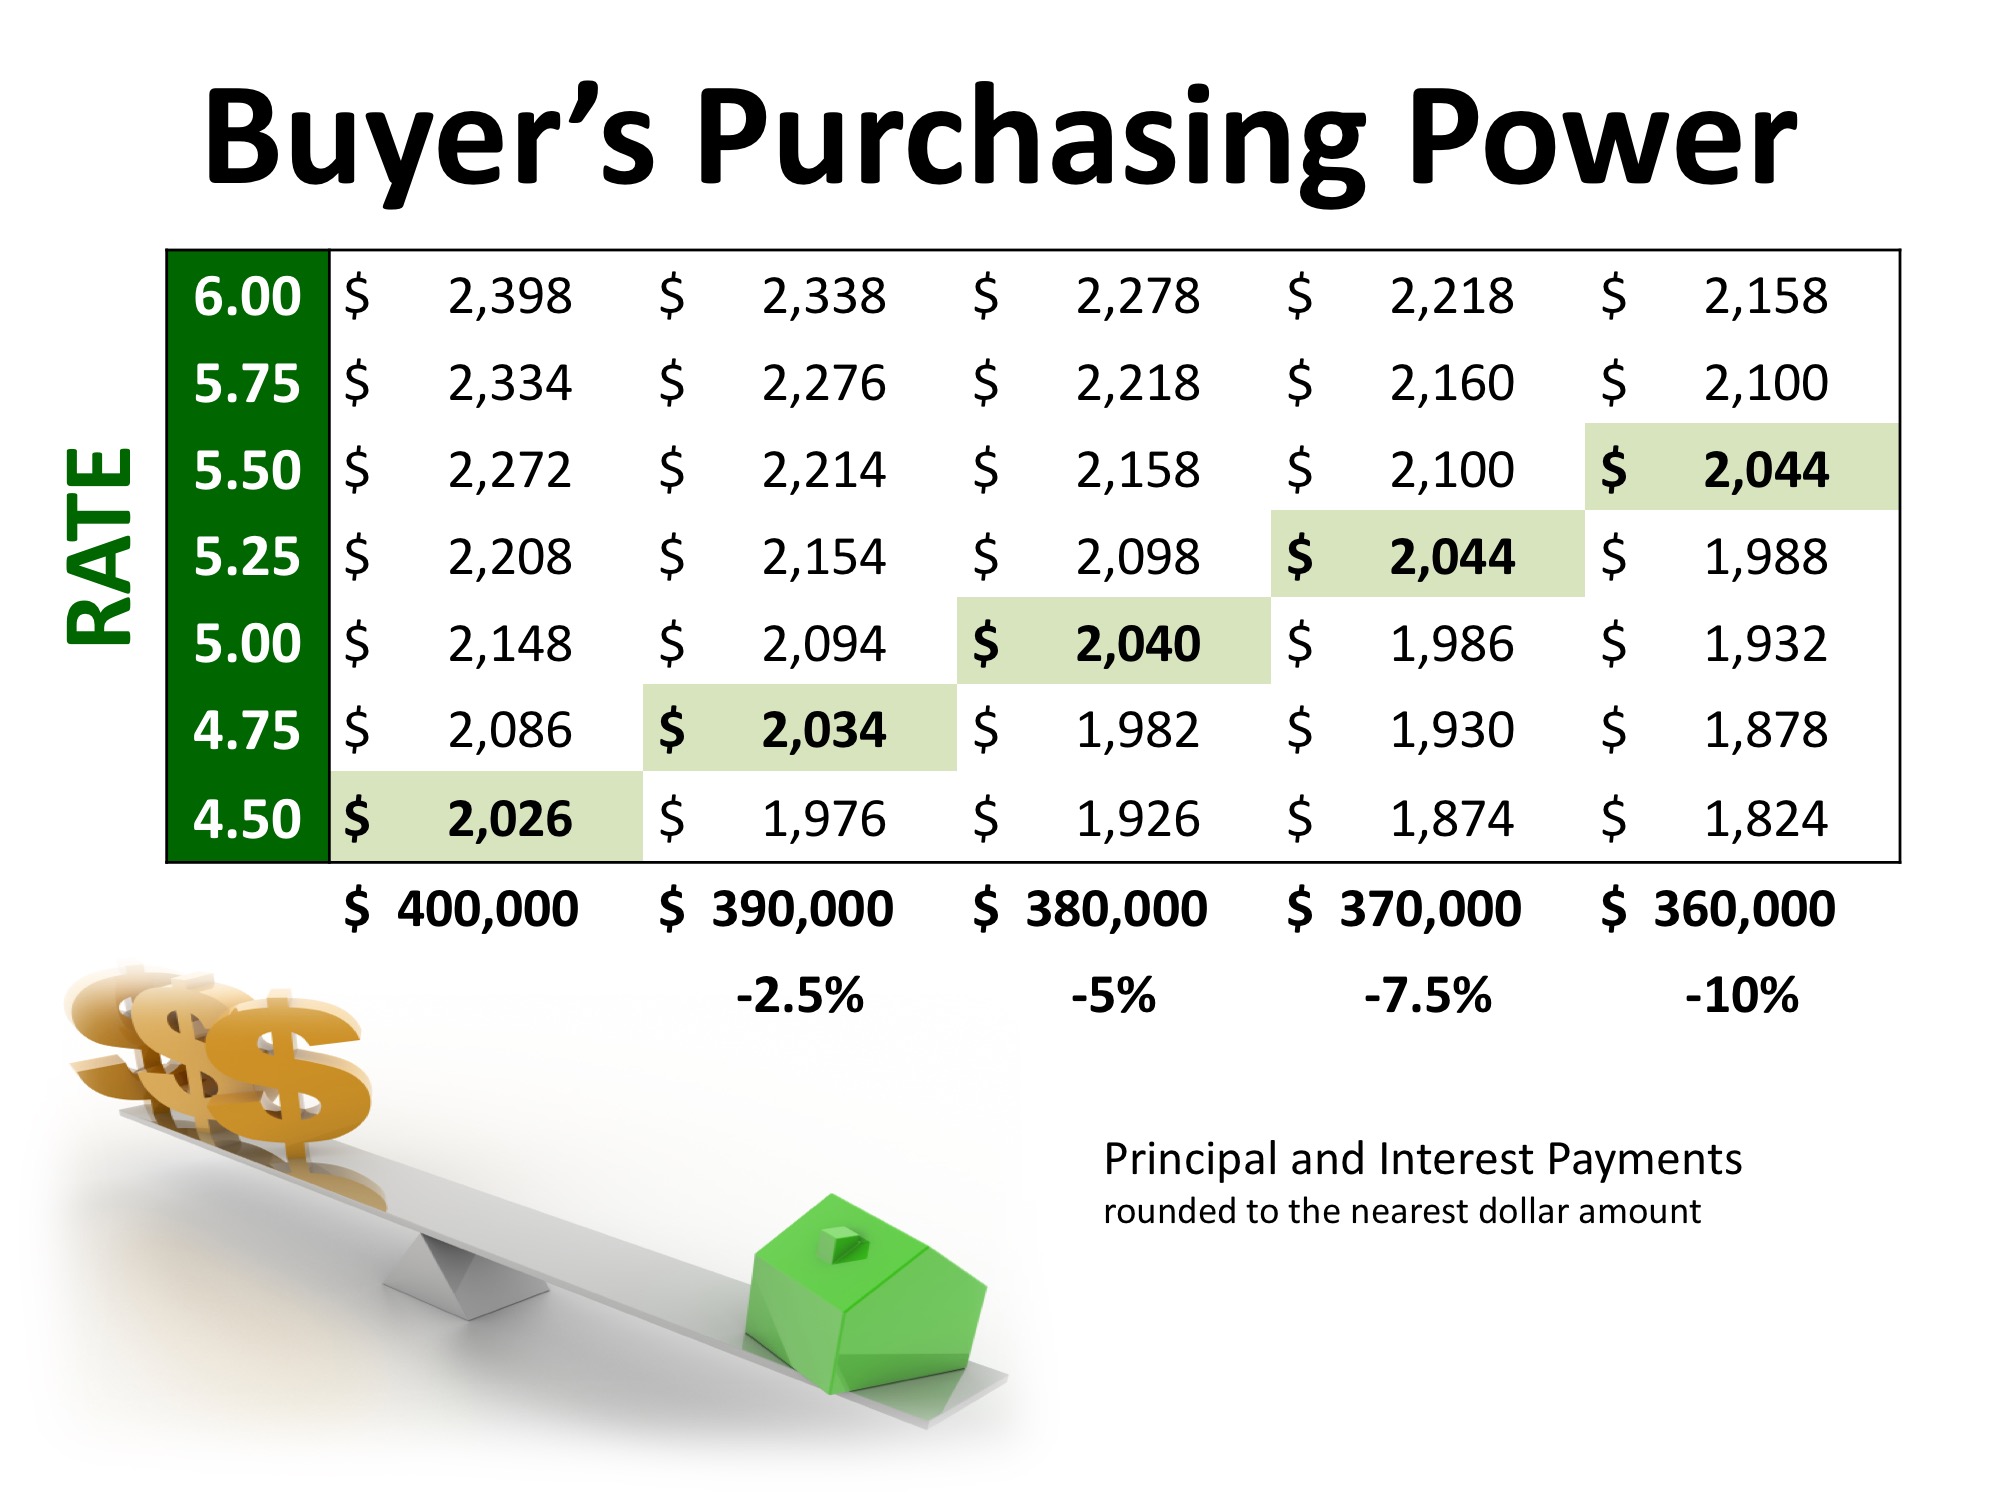
With each quarter of a percent increase in interest rate, the value of the home you can afford decreases by 2.5% (in this example, $10,000). Experts predict that mortgage rates will be over 5% by this time next year.
A ‘normal’ real estate market requires there to be a 6-month supply of homes for sale in order for prices to increase only with inflation. According to the National Association of Realtors (NAR), listing inventory is currently at a 4.3-month supply (still well below the 6-months needed), which has put upward pressure on home prices. Home prices have increased year-over-year for the last 78 straight months.
The inventory of homes for sale in the real estate market had been on a steady decline and experienced year-over-year drops for 36 straight months (from July 2015 to May 2018), but we are starting to see a shift in inventory over the last three months.
The chart below shows the change in housing supply over the last 12 months compared to the previous 12 months. As you can see, in June, July, and August, inventory levels have started to increase as compared to the same time last year.
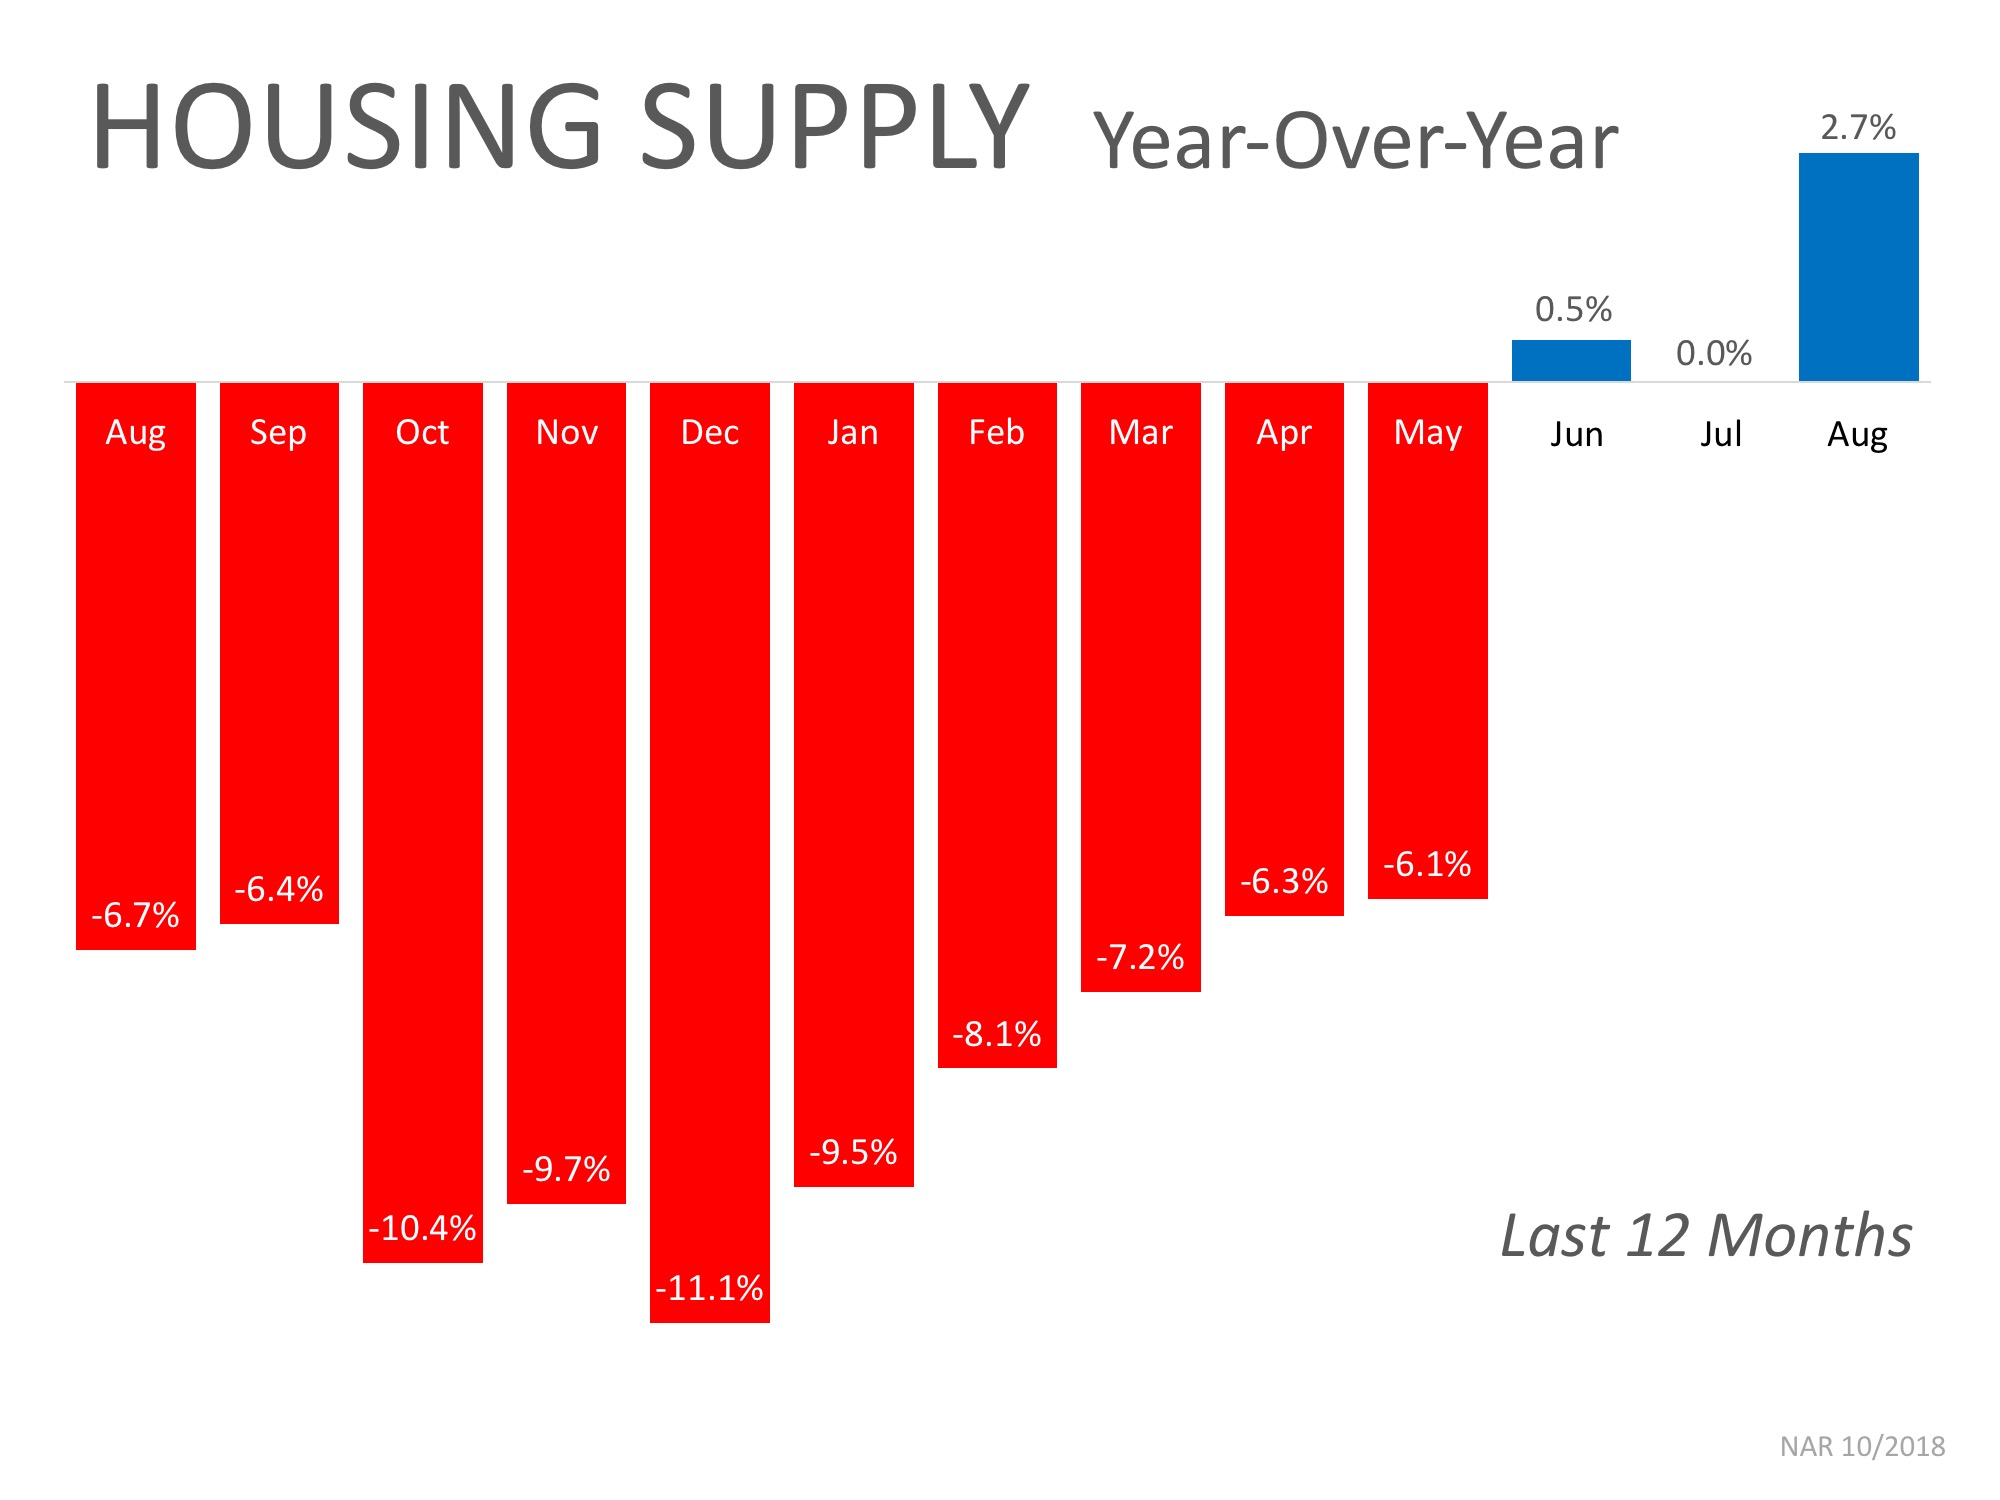
This is a trend to watch as we move further into the fall and winter months. If we continue to see an increase in homes for sale, we could start moving further away from a seller’s market and closer to a normal market.
If you are planning to enter the housing market, either as a buyer or a seller, let’s get together to discuss the changes in mortgage interest rates and inventory and what they could mean for you.
Posted in First Time Home Buyers, For Buyers, For Sellers, Interest Rates, Move-Up Buyers, Pricing

The price of any item is determined by the supply of that item, as well as the market’s demand for it. The National Association of REALTORS (NAR) surveys “over 50,000 real estate practitioners about their expectations for home sales, prices and market conditions” for their monthly REALTORS Confidence Index.
Their latest edition sheds some light on the relationship between seller traffic (supply) and buyer traffic (demand).
The map below was created after asking the question: “How would you rate buyer traffic in your area?”
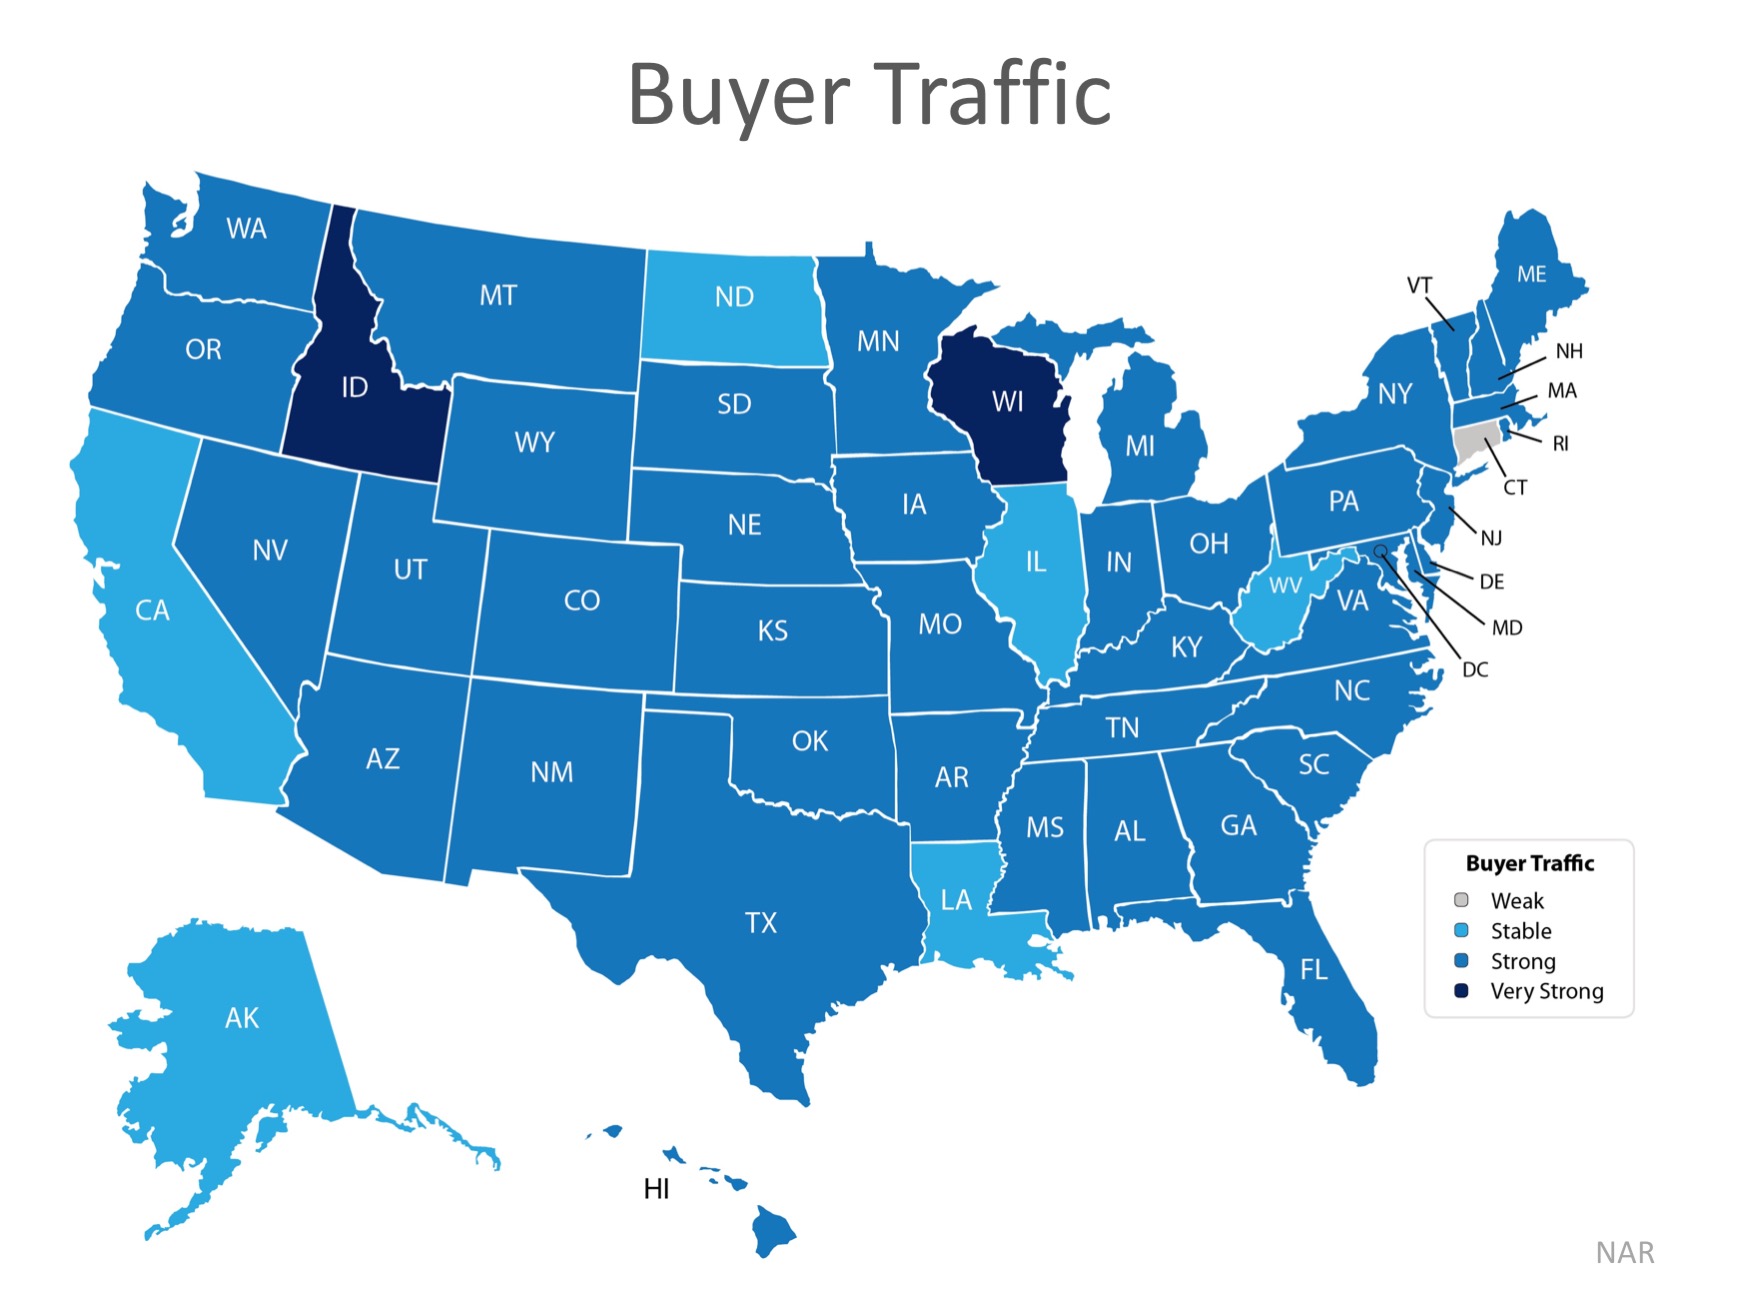
The darker the blue, the stronger the demand for homes is in that area. The survey showed that in 38 out of 50 states buyer demand was slightly lower than this time last year but remains strong. Only six states had a ‘stable’ demand level.
The index also asked: “How would you rate seller traffic in your area?”
As you can see from the map below, 23 states reported ‘weak’ seller traffic, 22 states and Washington D.C. reported ‘stable’ seller traffic, and 5 states reported ‘strong’ seller traffic. This means there are far fewer homes on the market than what is needed to satisfy the buyers who are out looking for homes.
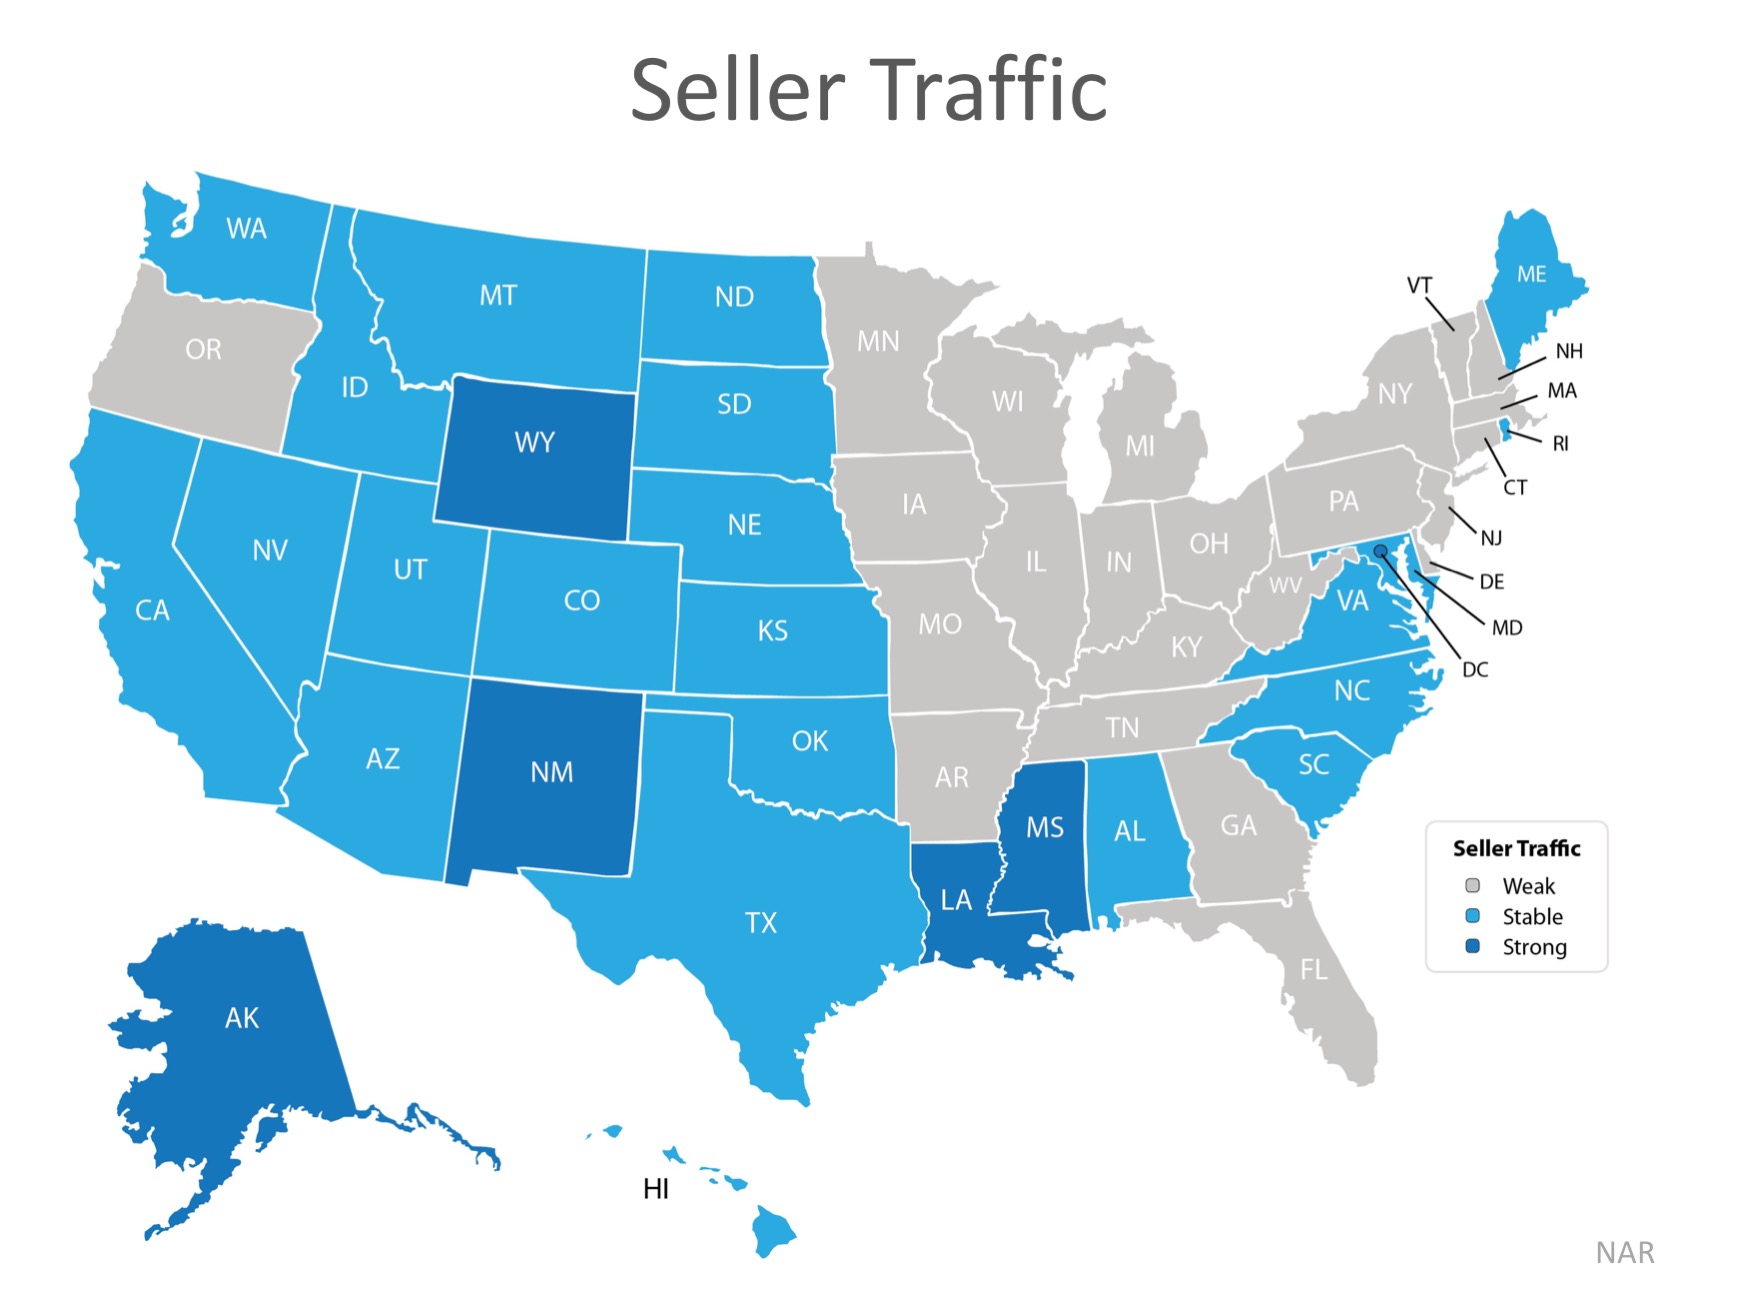
Looking at the maps above, it is not hard to see why prices are appreciating in many areas of the country. Until the supply of homes for sale starts to meet buyer demand, prices will continue to increase. If you are debating listing your home for sale, let’s get together so I can help you capitalize on the demand in the market now!
Posted in For Buyers, For Sellers

We are beginning to see reports that more housing inventory is coming to the market and that buyer demand may not be increasing at the same pace it did earlier this year. The result will be many headlines written to address the impact that these two situations will have on home values.
Many of these headline writers will confuse “softening home prices” with “falling home prices,” but there is a major difference between the two.
The data will begin to show that home values are not appreciating at the same levels as they had over the last several years (softening prices). This does NOT mean that prices are depreciating (falling prices).
Here is an example: Over the last several years, national home values increased by more than 6% annually. If you had a home worth $300,000 at the beginning of the year, it would be worth $318,000 by year’s end. If the appreciation rate “falls” to 4%, that $300,000 house would be worth $312,000 at the end of next year – a $6,000 difference.
The price of the home did not fall. It just didn’t increase at the level it had the previous year.
Appreciation rates are projected to end this year at approximately 5%, and then drop to somewhere between 4-5% next year. This drop in appreciation rate will cause home price increases to soften.
Be careful when reading headlines that discuss home values. Some headline writers will be legitimately confused and will use the word falling in place of softening. Others will realize that the headline “Home Prices are Falling!” will get more clicks than “Home Prices are Softening” and will intentionally write the more compelling headline. Read the article. If the word depreciation is not mentioned, home values are not falling.
Posted in First Time Home Buyers, For Buyers, For Sellers, Housing Market Updates, Move-Up Buyers, Pricing
For your home value estimate, enter the access code you received on the postcard, just click here: