Instant Home Estimate
For your home value estimate, enter the access code you received on the postcard, just click here:


There are many unsubstantiated theories about what is happening with home prices. From those who are worried that prices are falling (data shows this is untrue), to those who are concerned that prices are again approaching boom peaks because of “irrational exuberance” (this is also untrue as prices are not at peak levels when they are adjusted for inflation), there seems to be no shortage of opinion.
However, the increase in prices is easily explained by the theory of supply & demand. Whenever there is a limited supply of an item that is in high demand, prices increase. It is that simple. In real estate, it takes a six-month supply of existing salable inventory to maintain pricing stability. In most housing markets, anything less than six months will cause home values to appreciate and anything greater than seven months will cause prices to depreciate (see chart below).
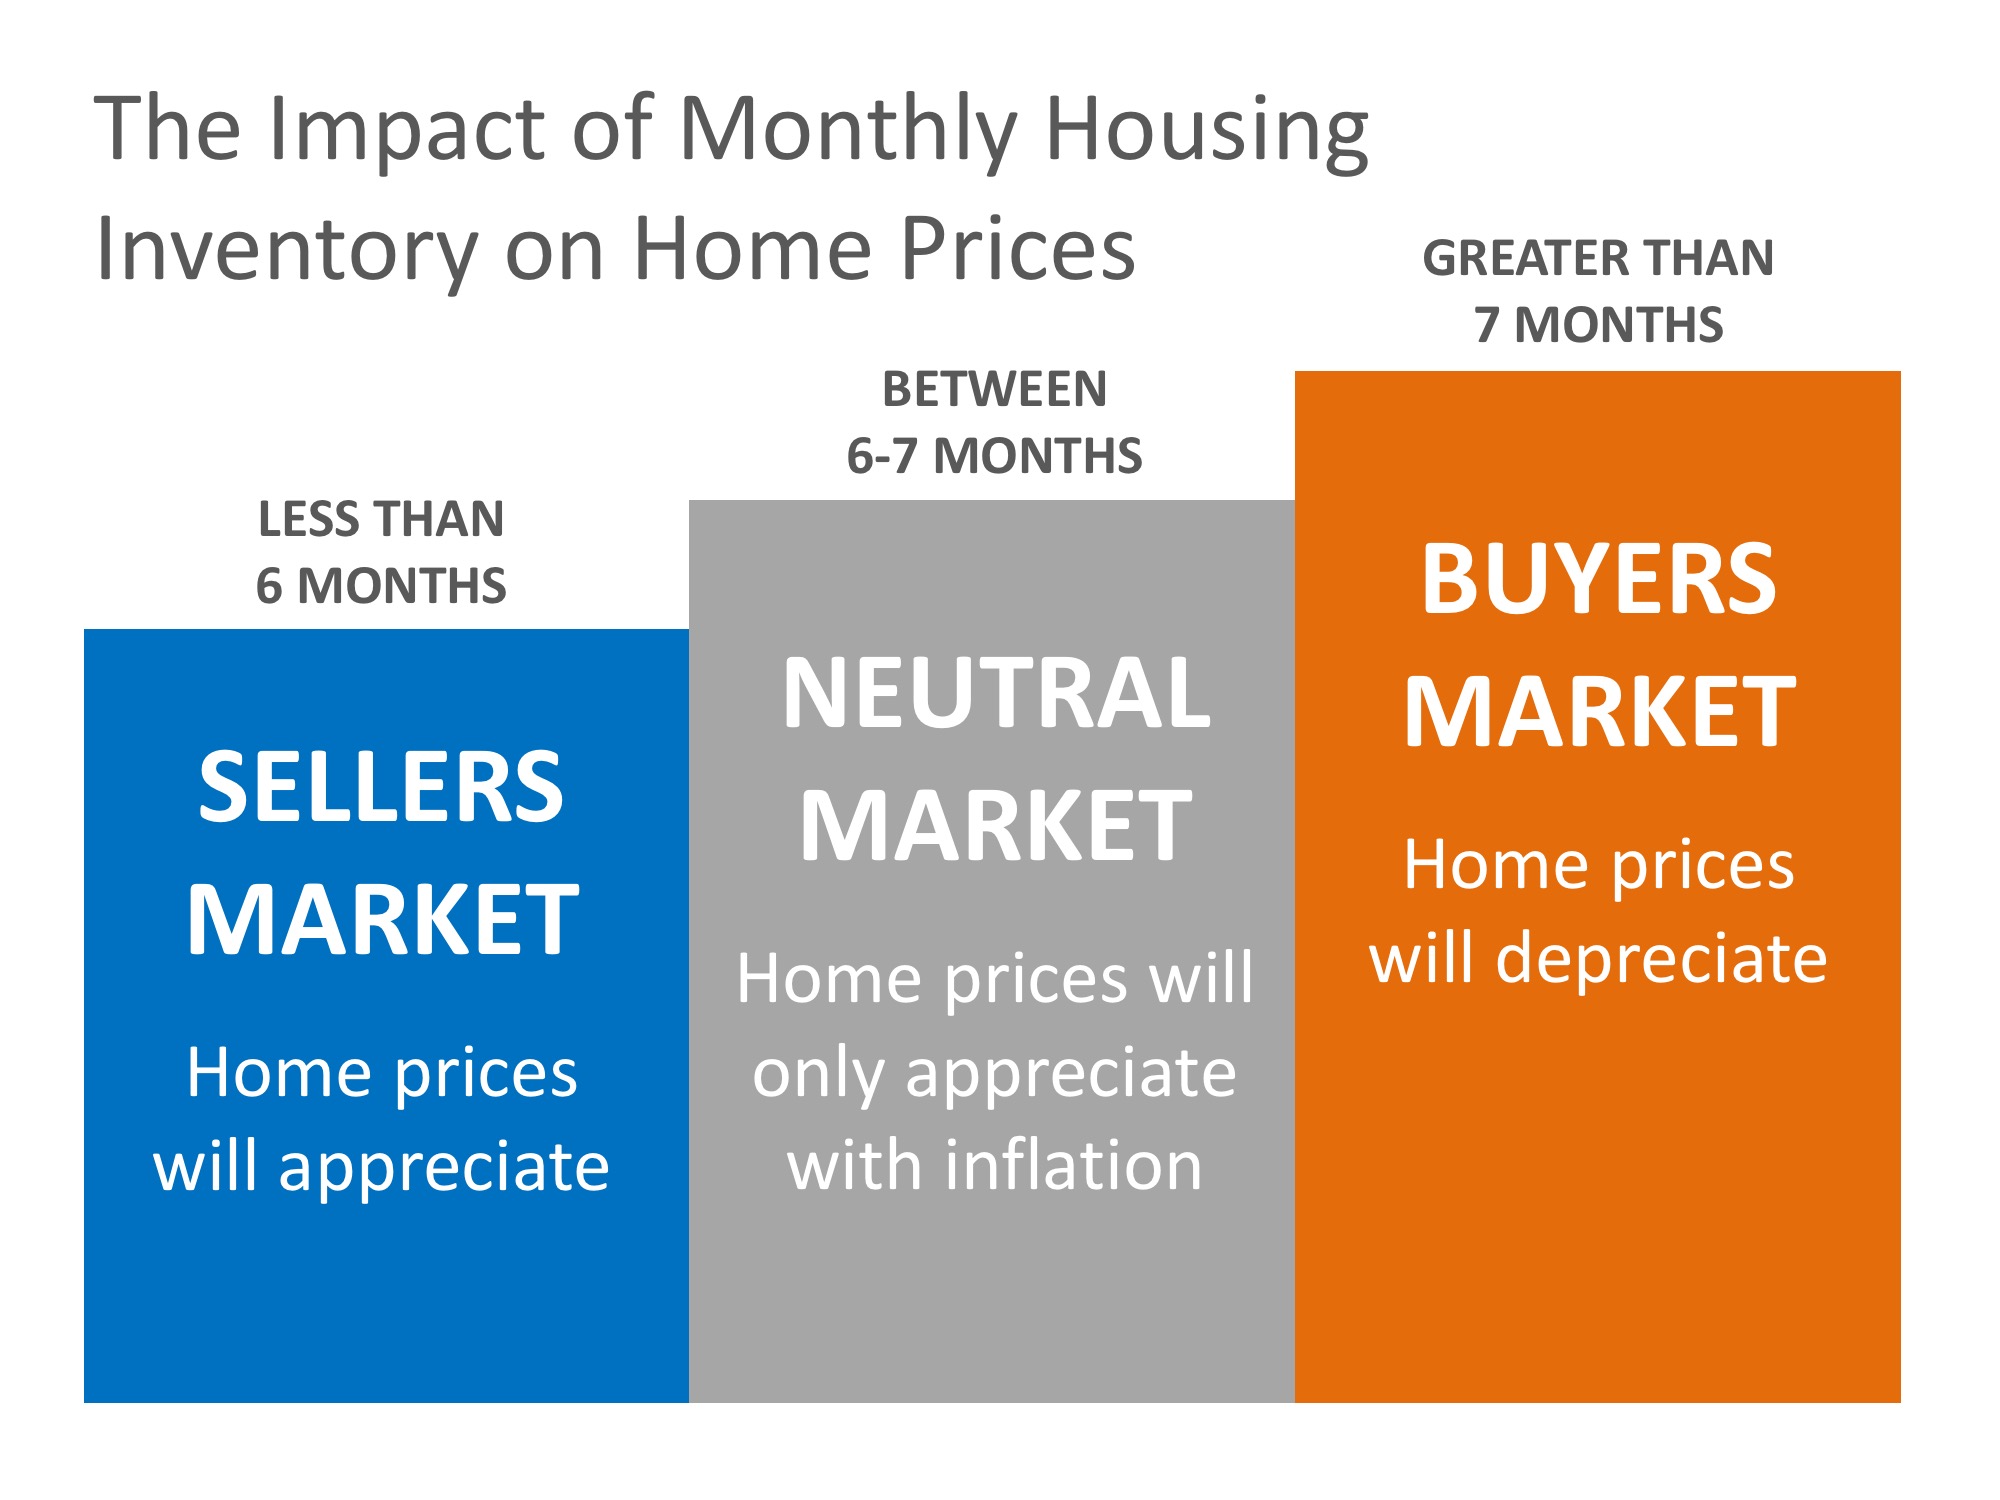
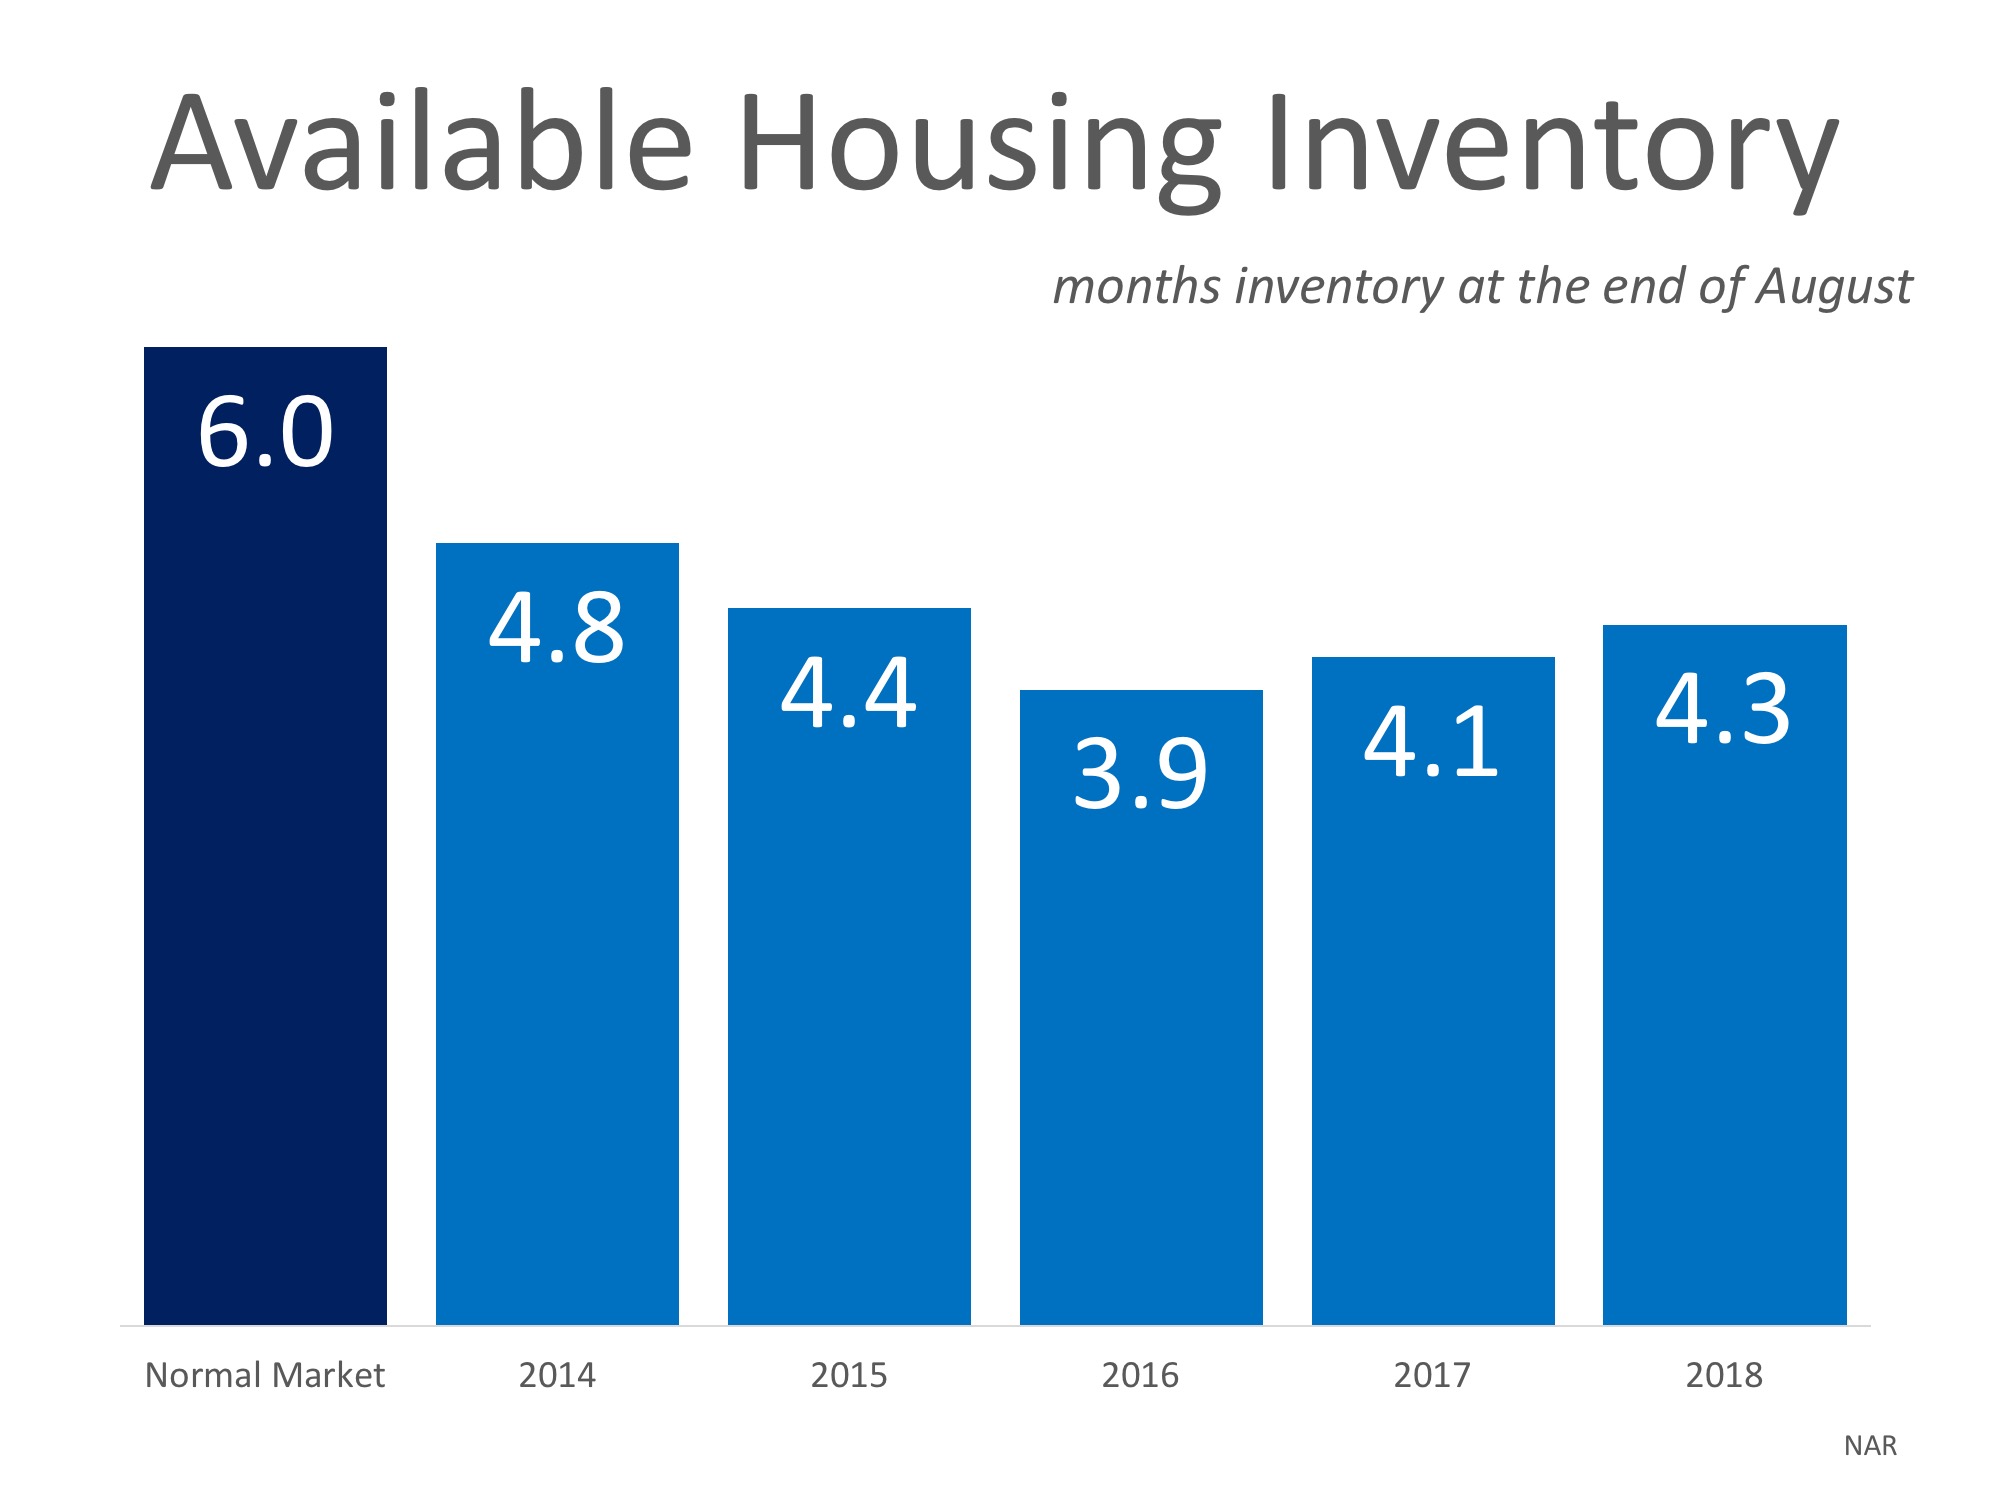
According to the Existing Home Sales Report from the National Association of Realtors (NAR), the monthly inventory of homes for sale has been below six months for the last five years (see chart below).
If buyer demand continues to outpace the current supply of existing homes for sale, prices will continue to appreciate. Nothing nefarious is taking place. It is simply the theory of supply & demand working as it should.
Posted in Buying Myths, First Time Home Buyers, For Buyers, For Sellers, Housing Market Updates, Move-Up Buyers, Pricing

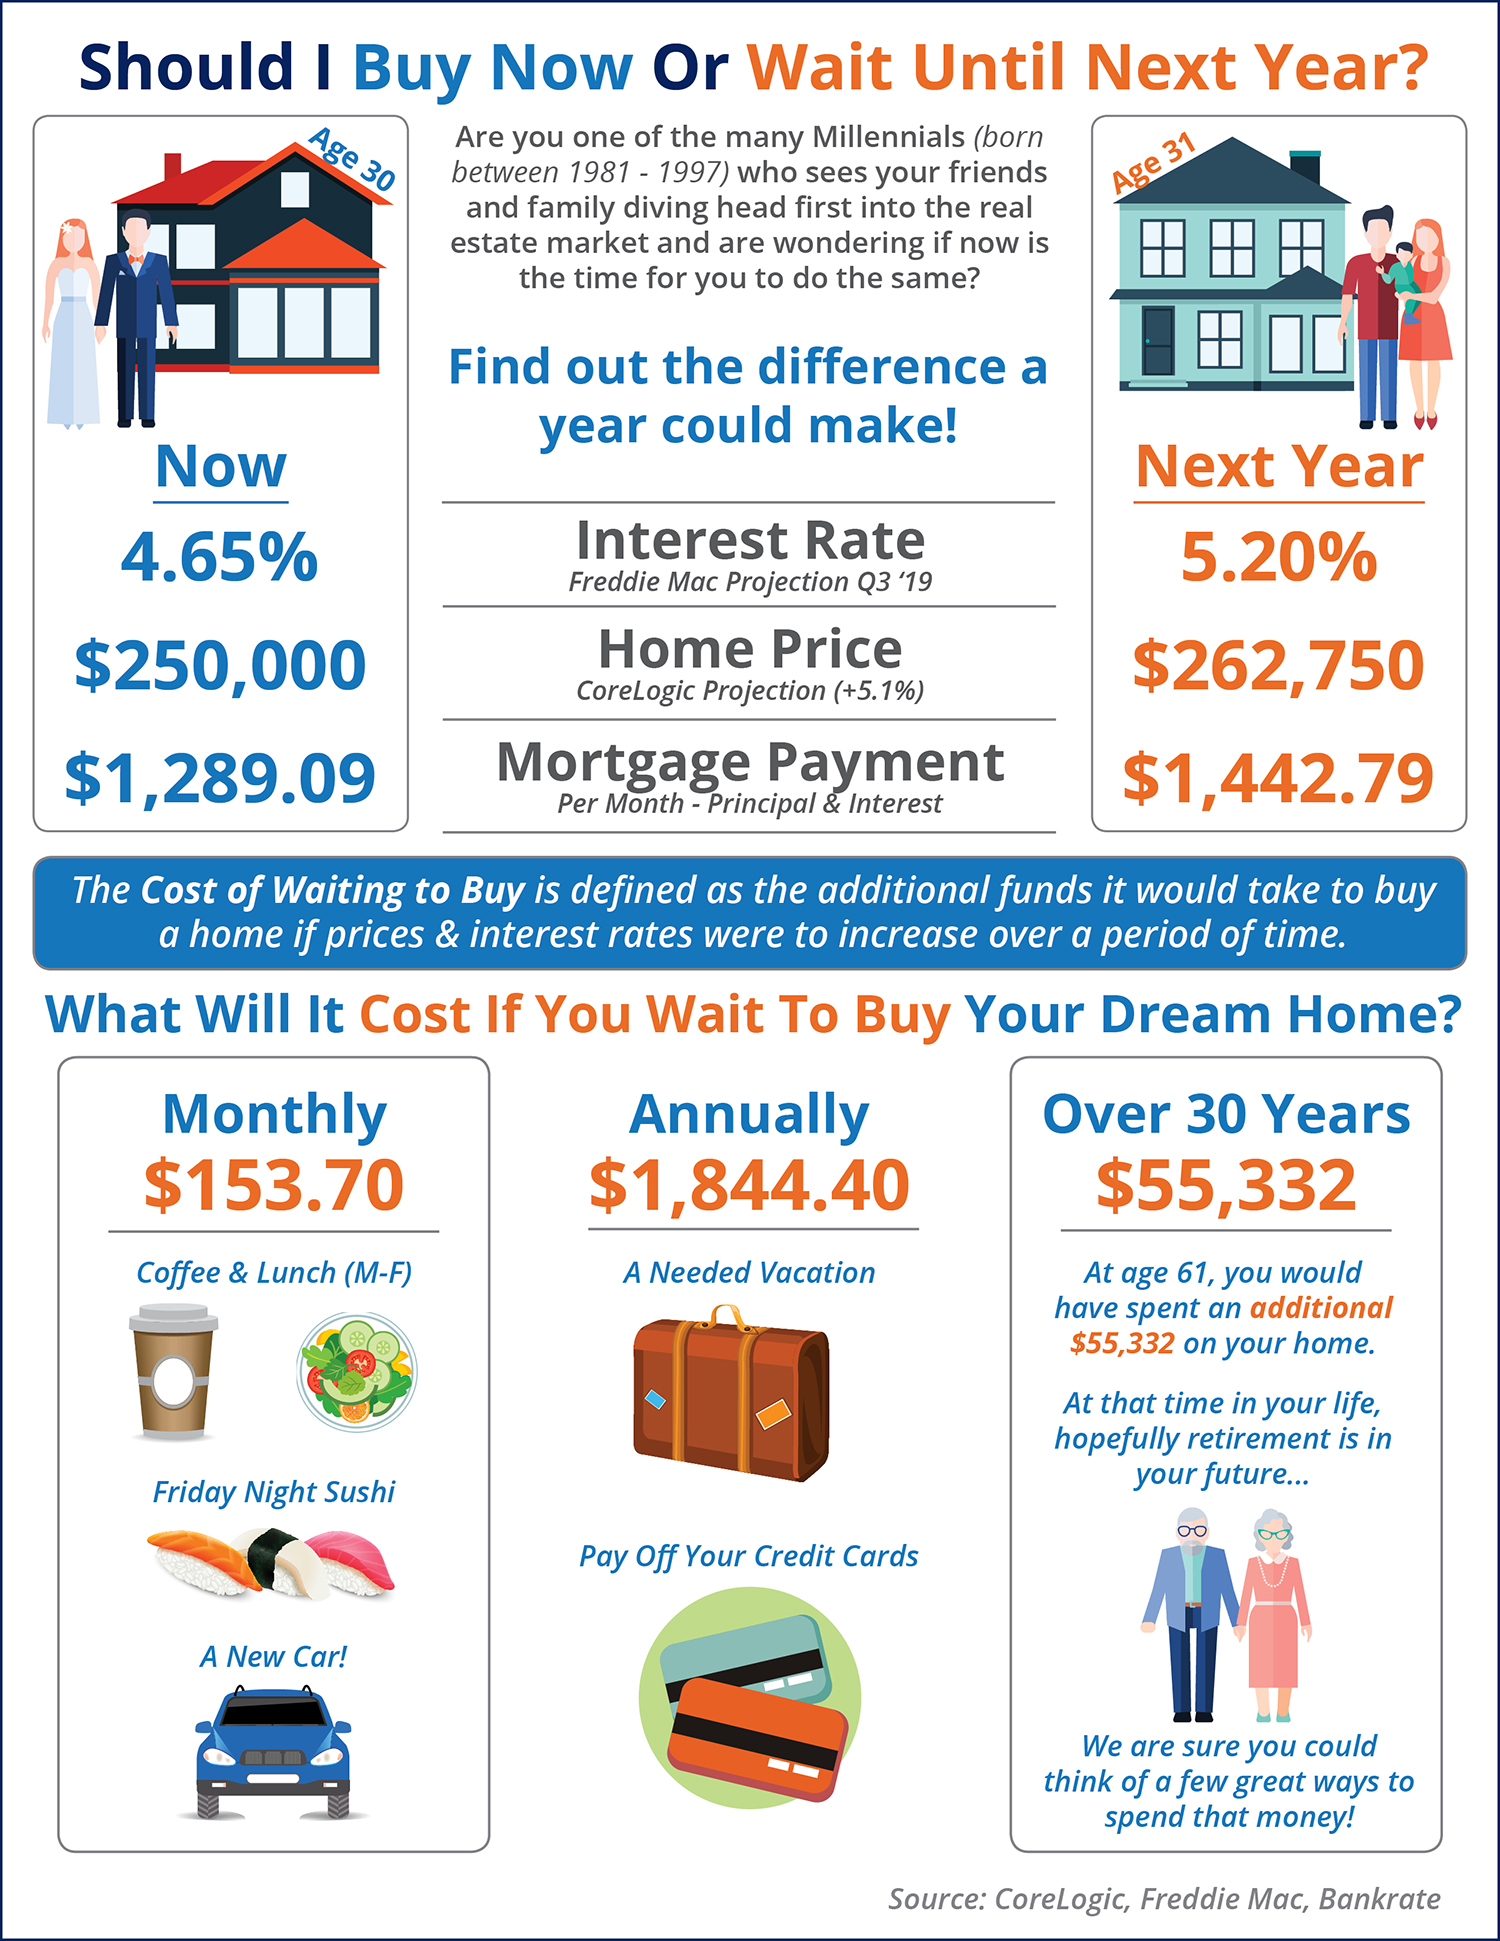
When it comes to buying or selling a home there are many factors you should consider. Where you want to live, why you want to buy or sell, and who will help you along your journey are just some of those factors. When it comes to today’s real estate market, though, the top two factors to consider are what’s happening with interest rates & inventory.
Mortgage interest rates have been on the rise and are now over three-quarters of a percentage point higher than they were at the beginning of the year. According to Freddie Mac’s latest Primary Mortgage Market Survey, rates climbed to 4.72% for a 30-year fixed rate mortgage last week.
The interest rate you secure when buying a home not only greatly impacts your monthly housing costs, but also impacts your purchasing power.
Purchasing power, simply put, is the amount of home you can afford to buy for the budget you have available to spend. As rates increase, the price of the house you can afford to buy will decrease if you plan to stay within a certain monthly housing budget.
The chart below shows the impact that rising interest rates would have if you planned to purchase a $400,000 home while keeping your principal and interest payments between $2,020-$2,050 a month.
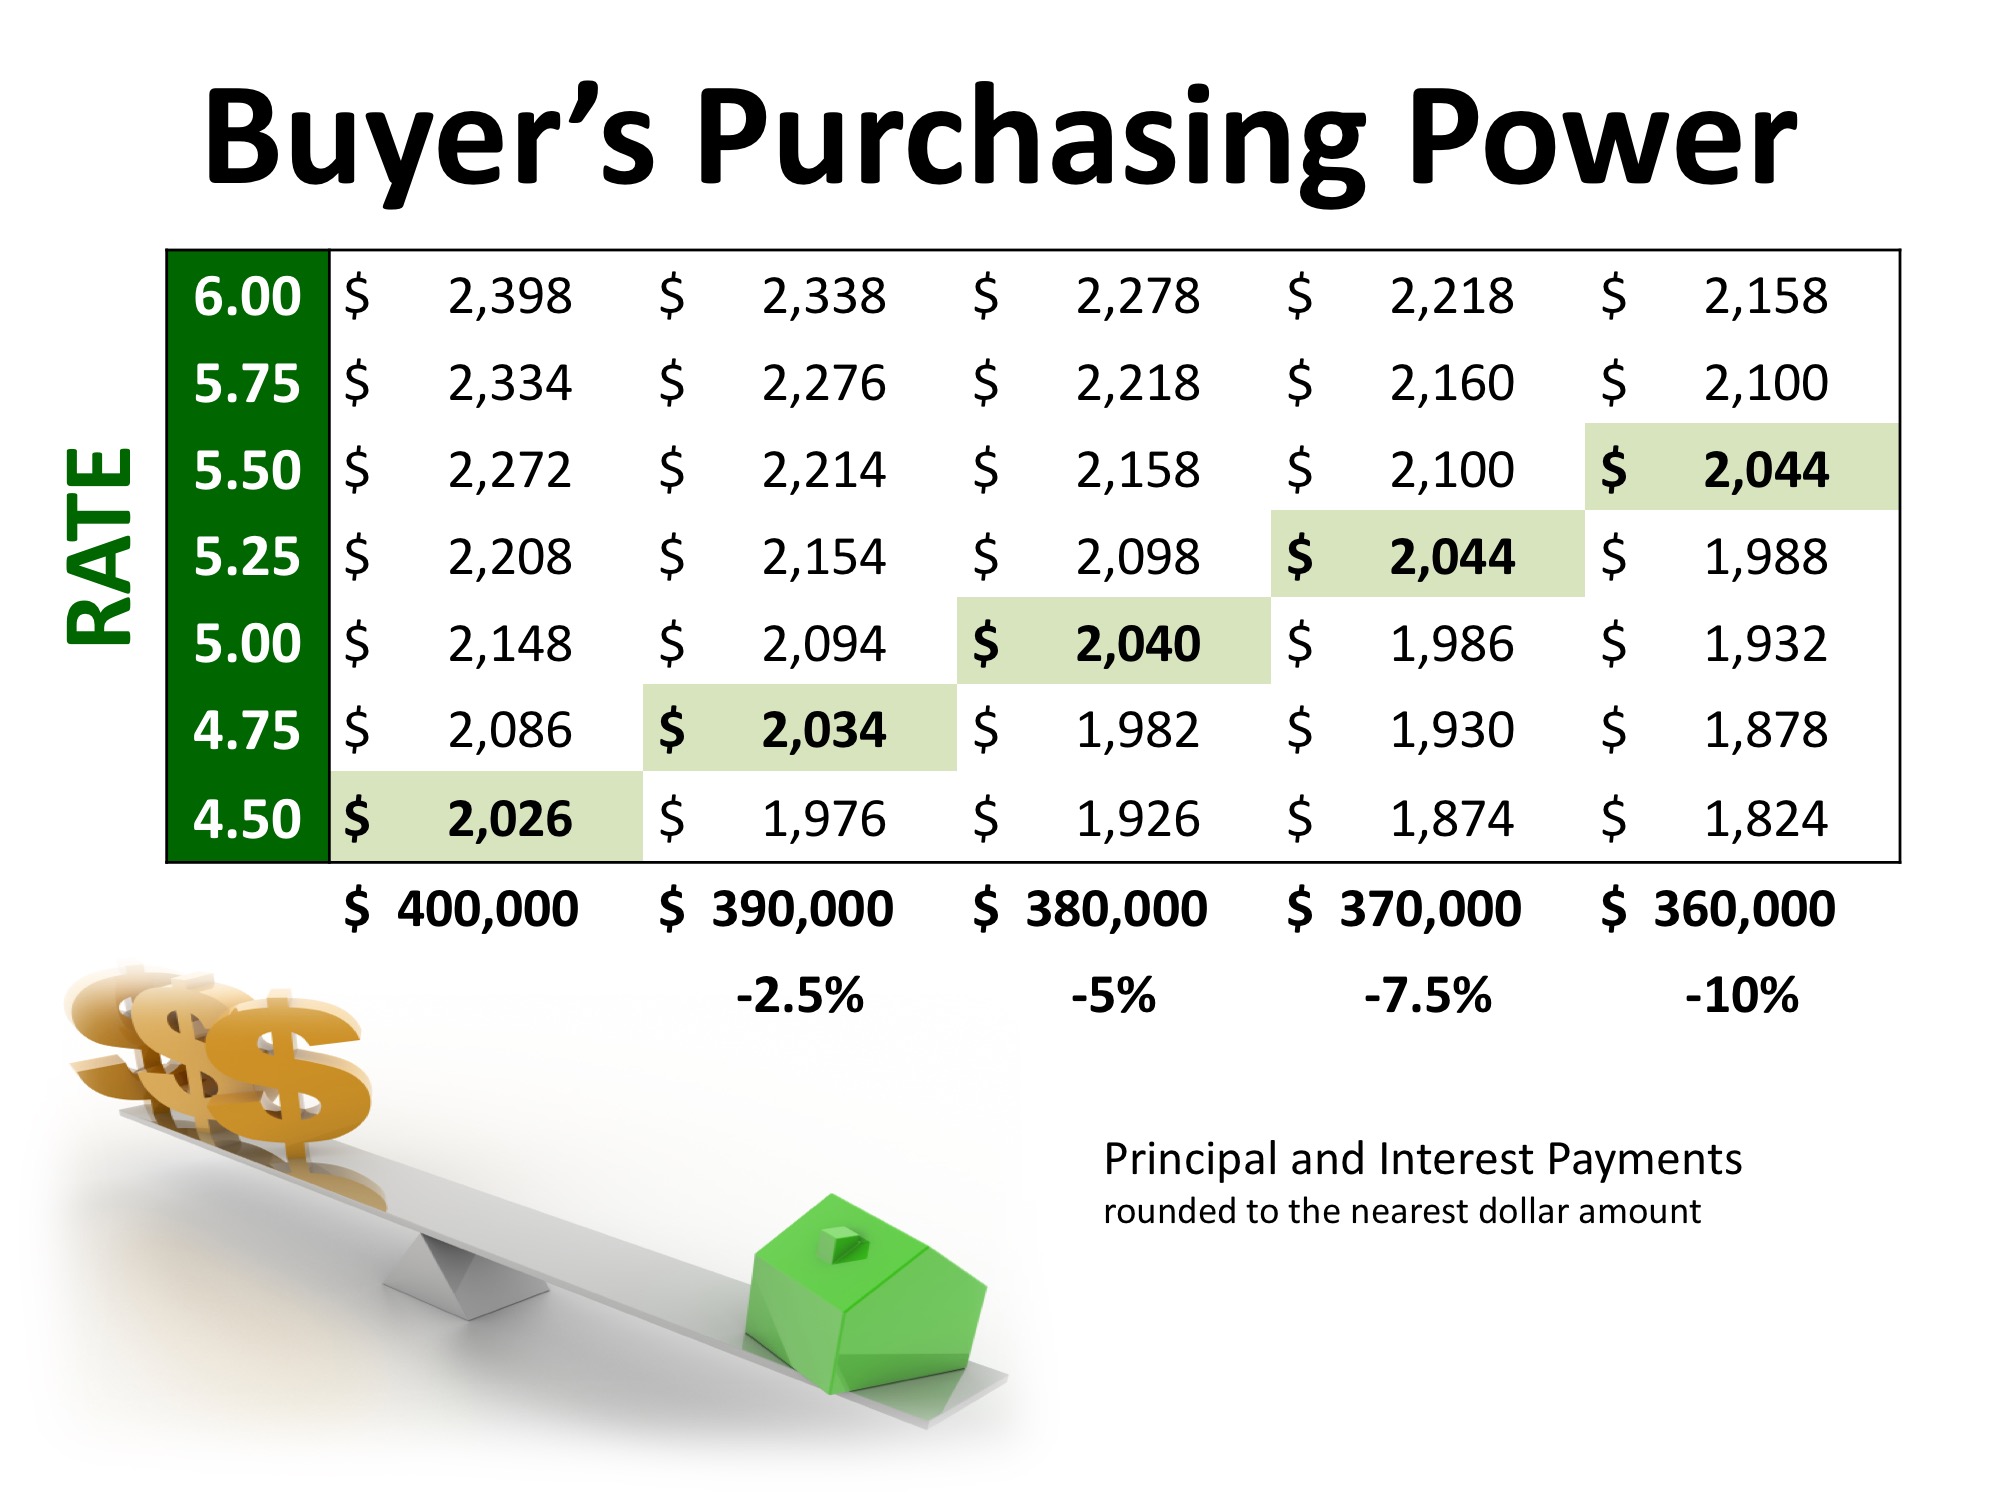
With each quarter of a percent increase in interest rate, the value of the home you can afford decreases by 2.5% (in this example, $10,000). Experts predict that mortgage rates will be over 5% by this time next year.
A ‘normal’ real estate market requires there to be a 6-month supply of homes for sale in order for prices to increase only with inflation. According to the National Association of Realtors (NAR), listing inventory is currently at a 4.3-month supply (still well below the 6-months needed), which has put upward pressure on home prices. Home prices have increased year-over-year for the last 78 straight months.
The inventory of homes for sale in the real estate market had been on a steady decline and experienced year-over-year drops for 36 straight months (from July 2015 to May 2018), but we are starting to see a shift in inventory over the last three months.
The chart below shows the change in housing supply over the last 12 months compared to the previous 12 months. As you can see, in June, July, and August, inventory levels have started to increase as compared to the same time last year.
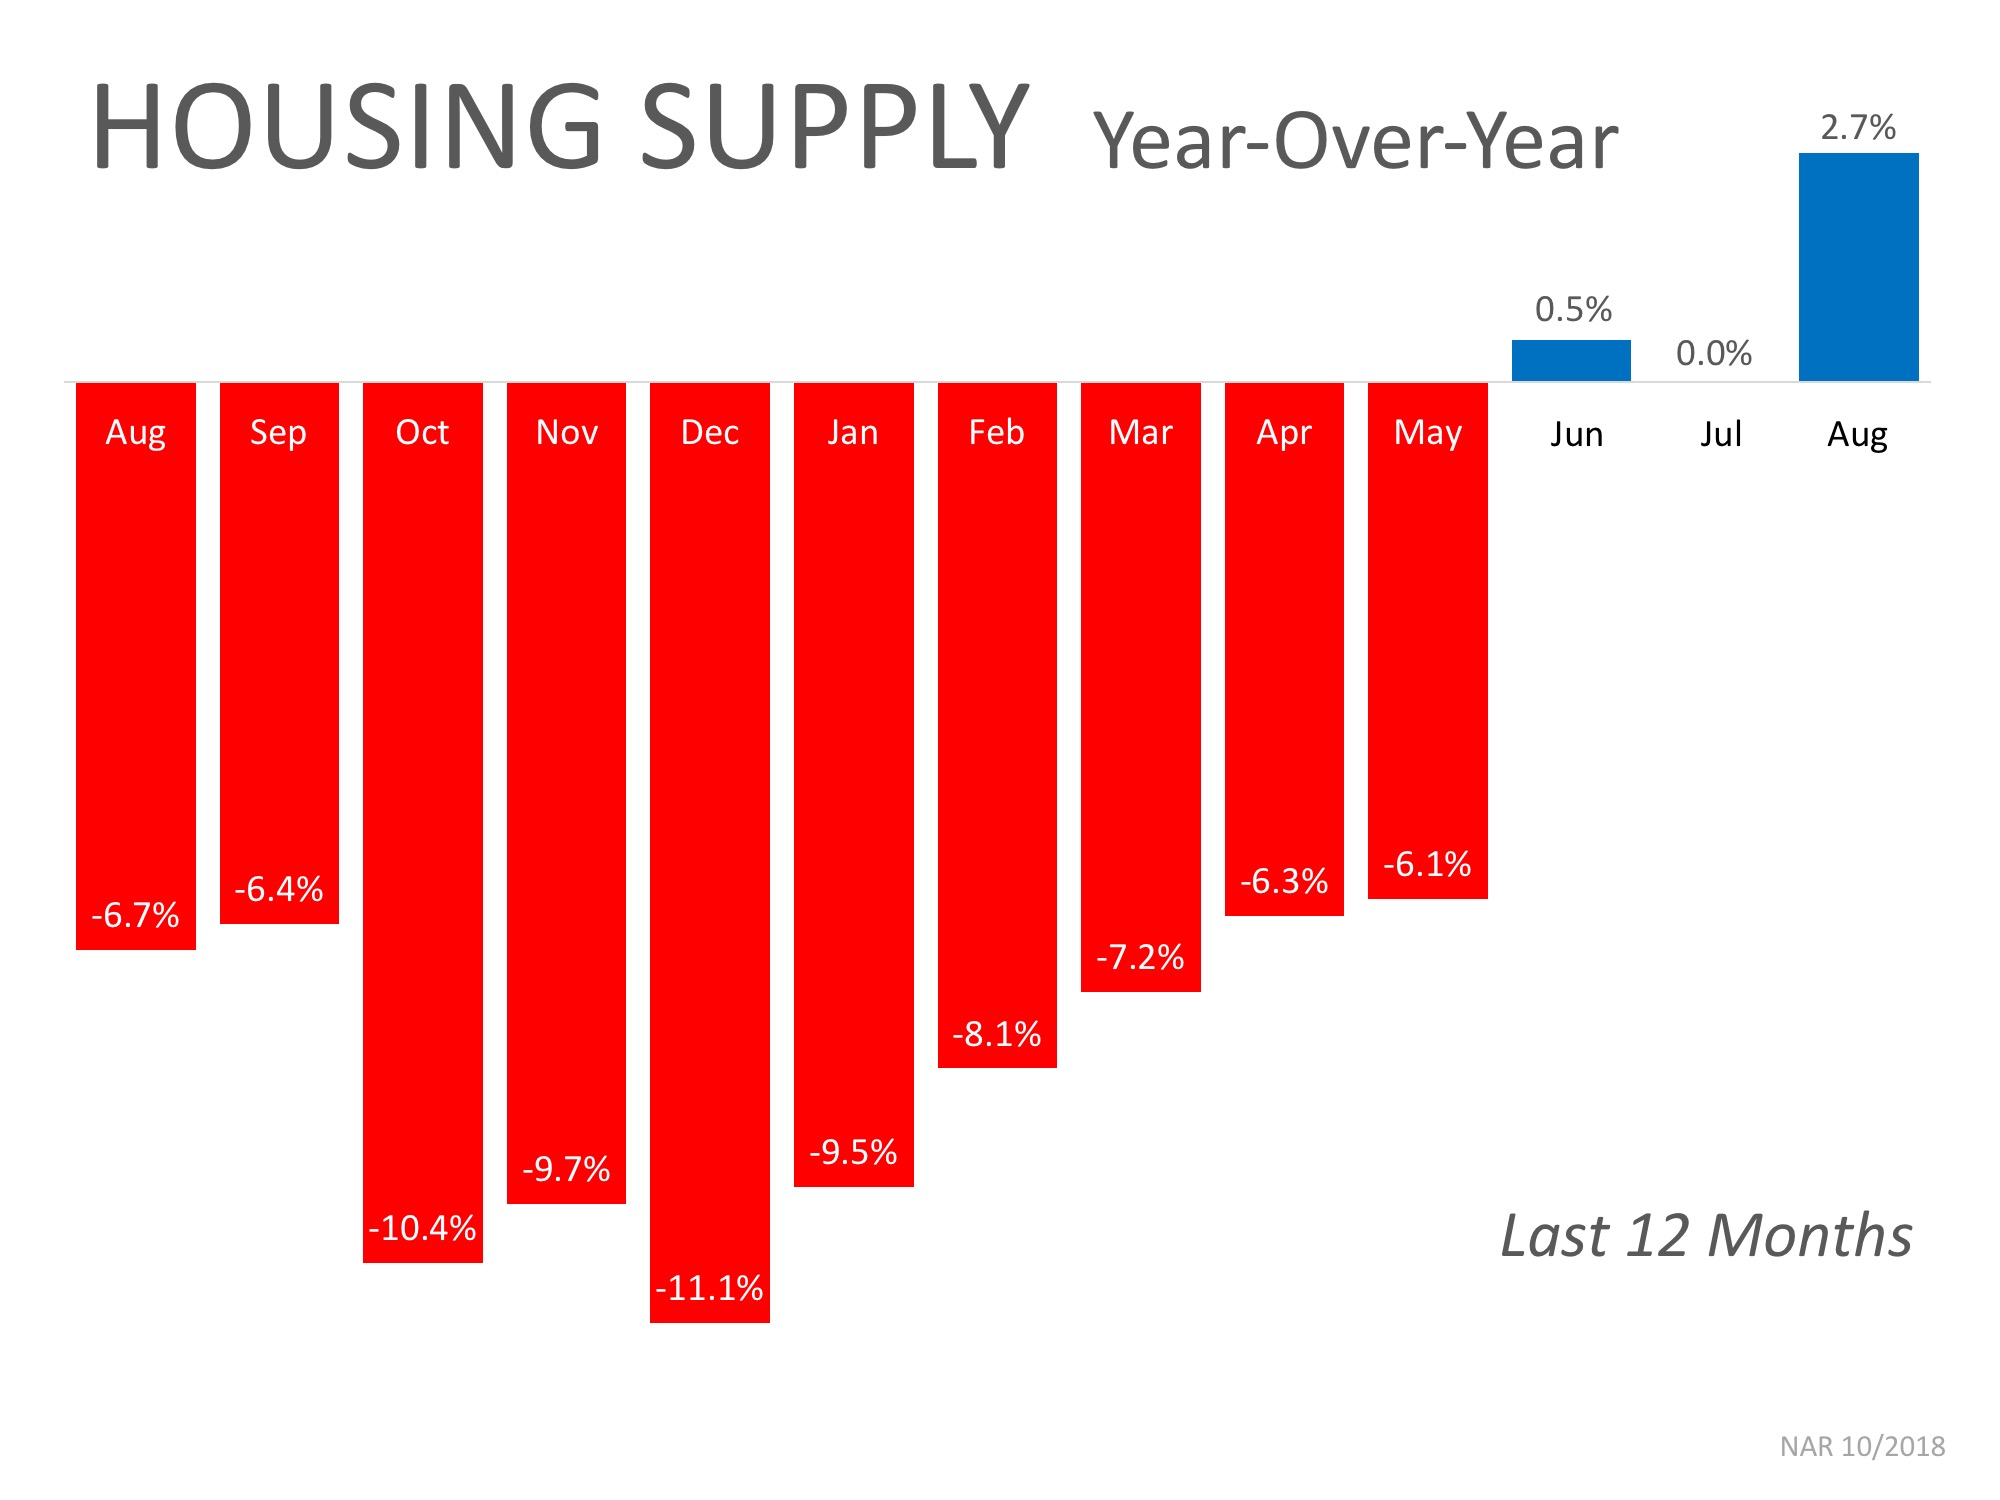
This is a trend to watch as we move further into the fall and winter months. If we continue to see an increase in homes for sale, we could start moving further away from a seller’s market and closer to a normal market.
If you are planning to enter the housing market, either as a buyer or a seller, let’s get together to discuss the changes in mortgage interest rates and inventory and what they could mean for you.
Posted in First Time Home Buyers, For Buyers, For Sellers, Interest Rates, Move-Up Buyers, Pricing

Posted in First Time Home Buyers, For Buyers, Infographics, Interest Rates, Millennials, Move-Up Buyers, Pricing

We are beginning to see reports that more housing inventory is coming to the market and that buyer demand may not be increasing at the same pace it did earlier this year. The result will be many headlines written to address the impact that these two situations will have on home values.
Many of these headline writers will confuse “softening home prices” with “falling home prices,” but there is a major difference between the two.
The data will begin to show that home values are not appreciating at the same levels as they had over the last several years (softening prices). This does NOT mean that prices are depreciating (falling prices).
Here is an example: Over the last several years, national home values increased by more than 6% annually. If you had a home worth $300,000 at the beginning of the year, it would be worth $318,000 by year’s end. If the appreciation rate “falls” to 4%, that $300,000 house would be worth $312,000 at the end of next year – a $6,000 difference.
The price of the home did not fall. It just didn’t increase at the level it had the previous year.
Appreciation rates are projected to end this year at approximately 5%, and then drop to somewhere between 4-5% next year. This drop in appreciation rate will cause home price increases to soften.
Be careful when reading headlines that discuss home values. Some headline writers will be legitimately confused and will use the word falling in place of softening. Others will realize that the headline “Home Prices are Falling!” will get more clicks than “Home Prices are Softening” and will intentionally write the more compelling headline. Read the article. If the word depreciation is not mentioned, home values are not falling.
Posted in First Time Home Buyers, For Buyers, For Sellers, Housing Market Updates, Move-Up Buyers, Pricing

The latest Existing Home Sales Report issued by the National Association of Realtors (NAR) revealed that home sales have decreased for four consecutive months and are at their slowest pace in over two years. This has some industry leaders puzzled considering the fact that the economy is strengthening, unemployment is down, and wages are beginning to rise. This begs the question: “Where are the buyers?”
Actually, agents in the field of most communities are still seeing strong desire from prospective purchasers. They have a list of potential buyers ready to go if the right houses come on the market and they claim it is not a shortage of demand, but is instead a shortage of inventory that is causing the market to soften.
You only need to look at the graph below to understand:

New construction sales over the last ten years are far below historic numbers from 1995-2002.
A recent industry report looked at building permits and concluded:
“If construction over the past decade matched historic norms, accounting for population change, the country would have had 2.3 million more single-family home permits.”
That decade of not building enough homes is the primary reason for the concerns about today’s market.
Some may argue that NAR’s sales report deals with existing home sales and not new construction, and they would be correct. However, reports have shown that one of the main reasons why existing homeowners are not selling is because they can’t find homes that meet the needs of their current lifestyles. Historically, the upgrades in a newly constructed home were the answers to those needs.
Over the last decade, however, there were fewer homes built to satisfy this move-up seller. Consequently, there are many homeowners who stayed in their homes for a longer tenure, instead of putting their homes up for sale.
As more new homes are being built, there will be more housing inventory to satisfy current demand which will cause prices to moderate and sales volumes to increase.
Posted in For Buyers, For Sellers, Housing Market Updates, Move-Up Buyers, Pricing

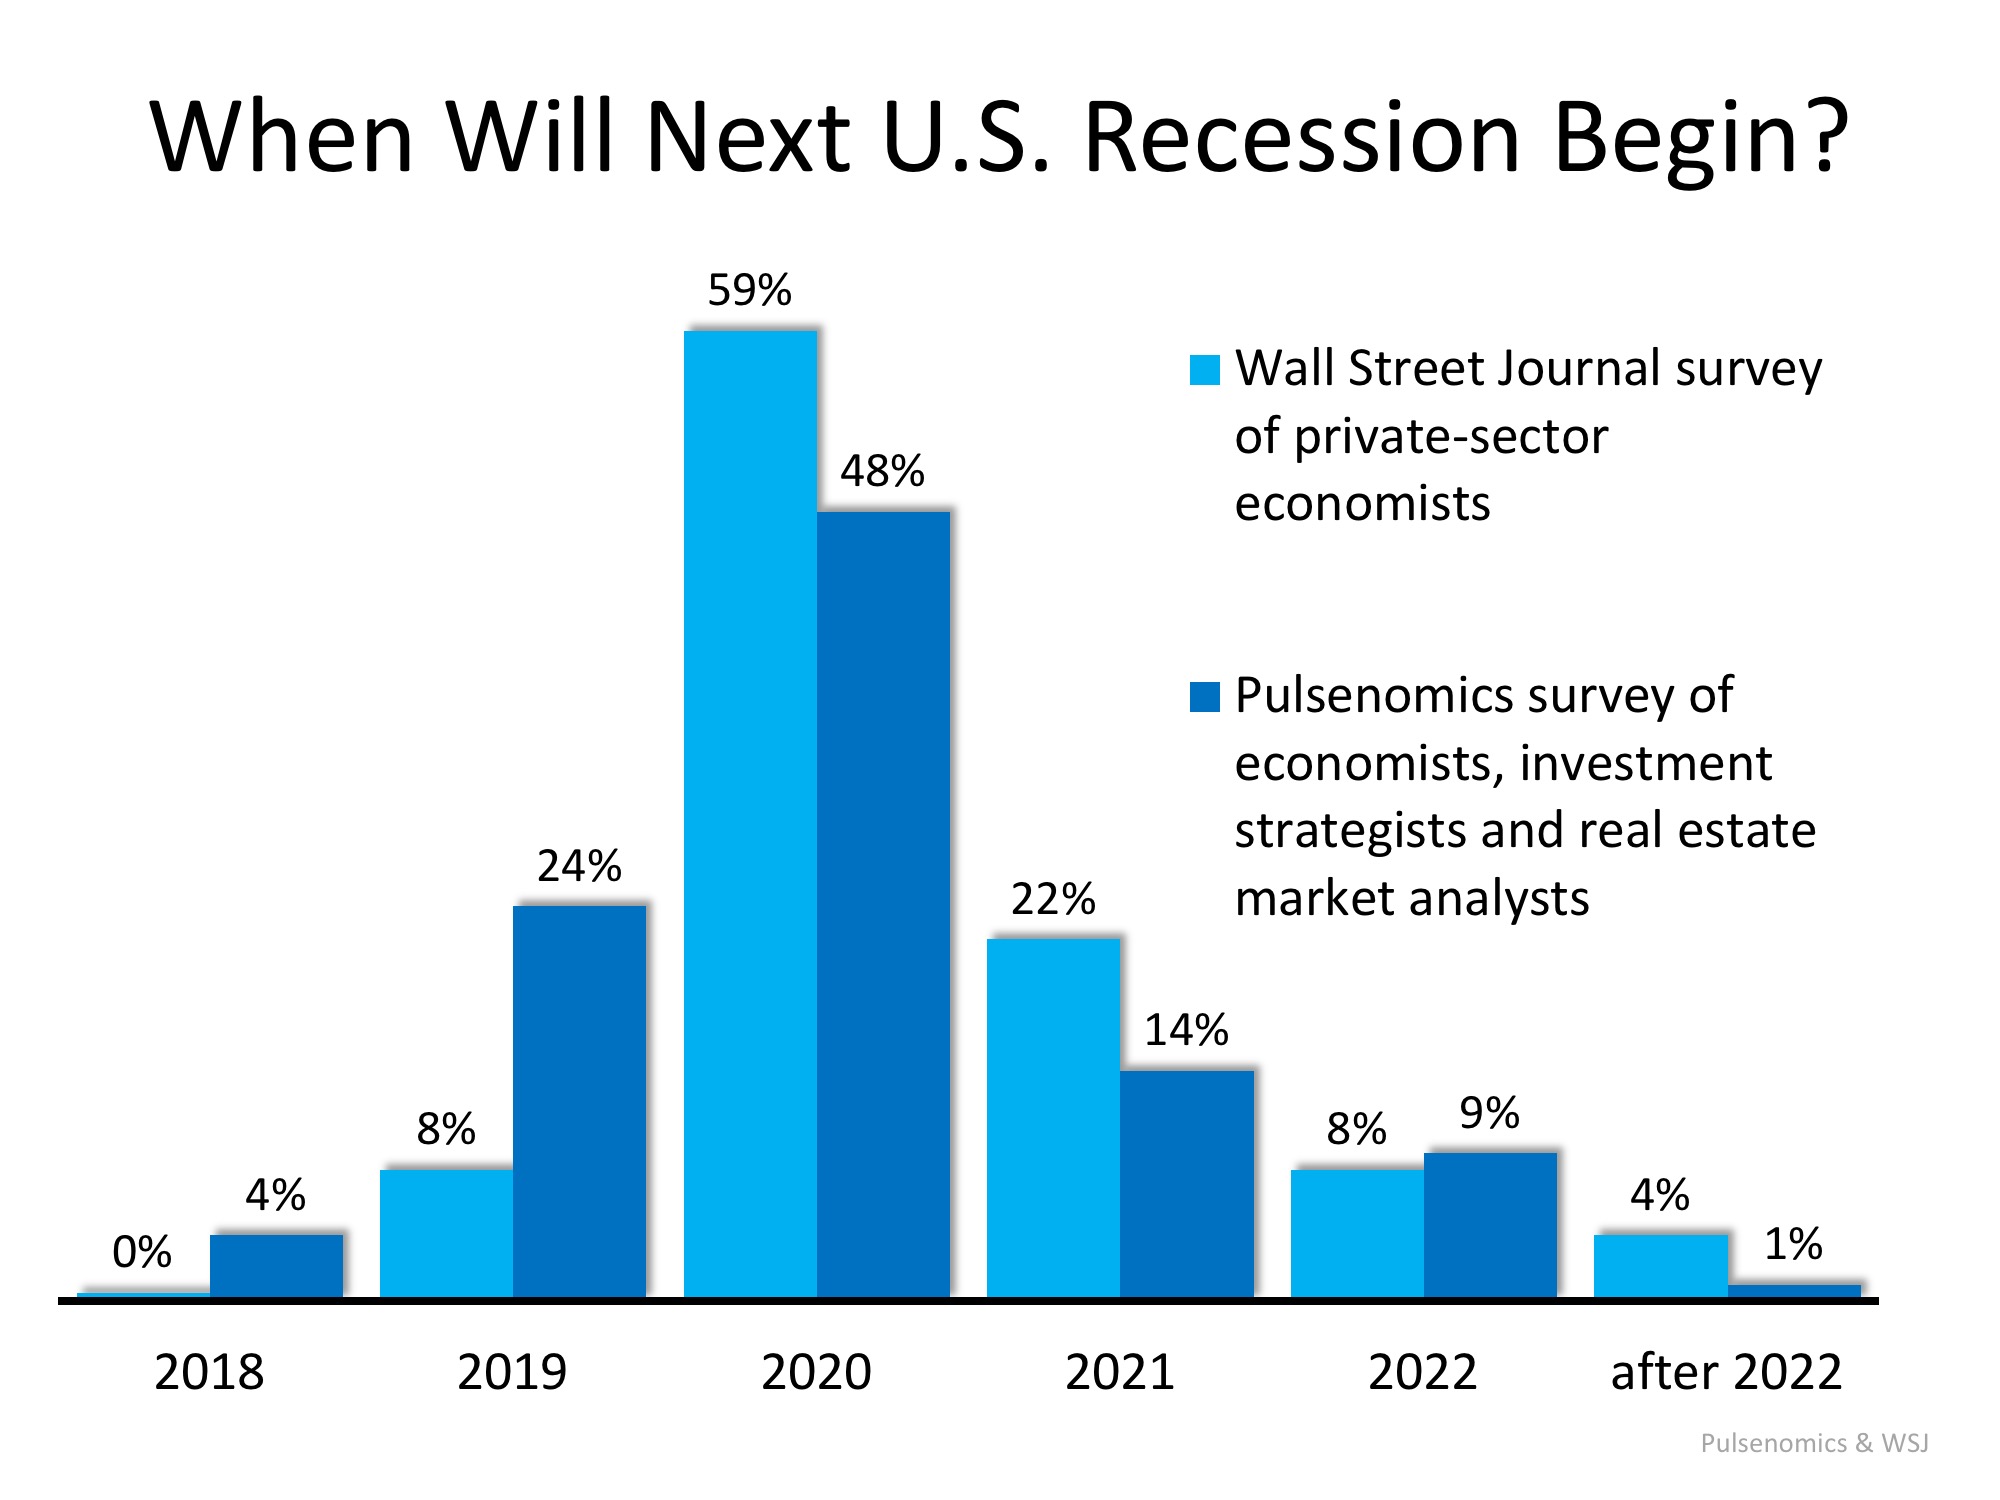
Economists and analysts know that the country has experienced economic growth for almost a decade. They also know that a recession can’t be too far off. A recent report by Zillow Research shed light on a survey conducted by Pulsenomics in which they asked economists, investment strategists and market analysts how they felt about the current housing market. That report revealed the possible timing of the next recession:
“Experts largely expect the next recession to begin in 2020.”
That timing concurs with a recent survey of economists by the Wall Street Journal:
“The economic expansion that began in mid-2009 and already ranks as the second-longest in American history most likely will end in 2020 as the Federal Reserve raises interest rates to cool off an overheating economy, according to forecasters surveyed.”
Here is a graph comparing the opinions of those surveyed by both the Wall Street Journal and Pulsenomics:
According to the Merriam-Webster Dictionary, a recession is defined as follows:
“A period of temporary economic decline during which trade and industrial activity are reduced, generally identified by a fall in GDP in two successive quarters.”
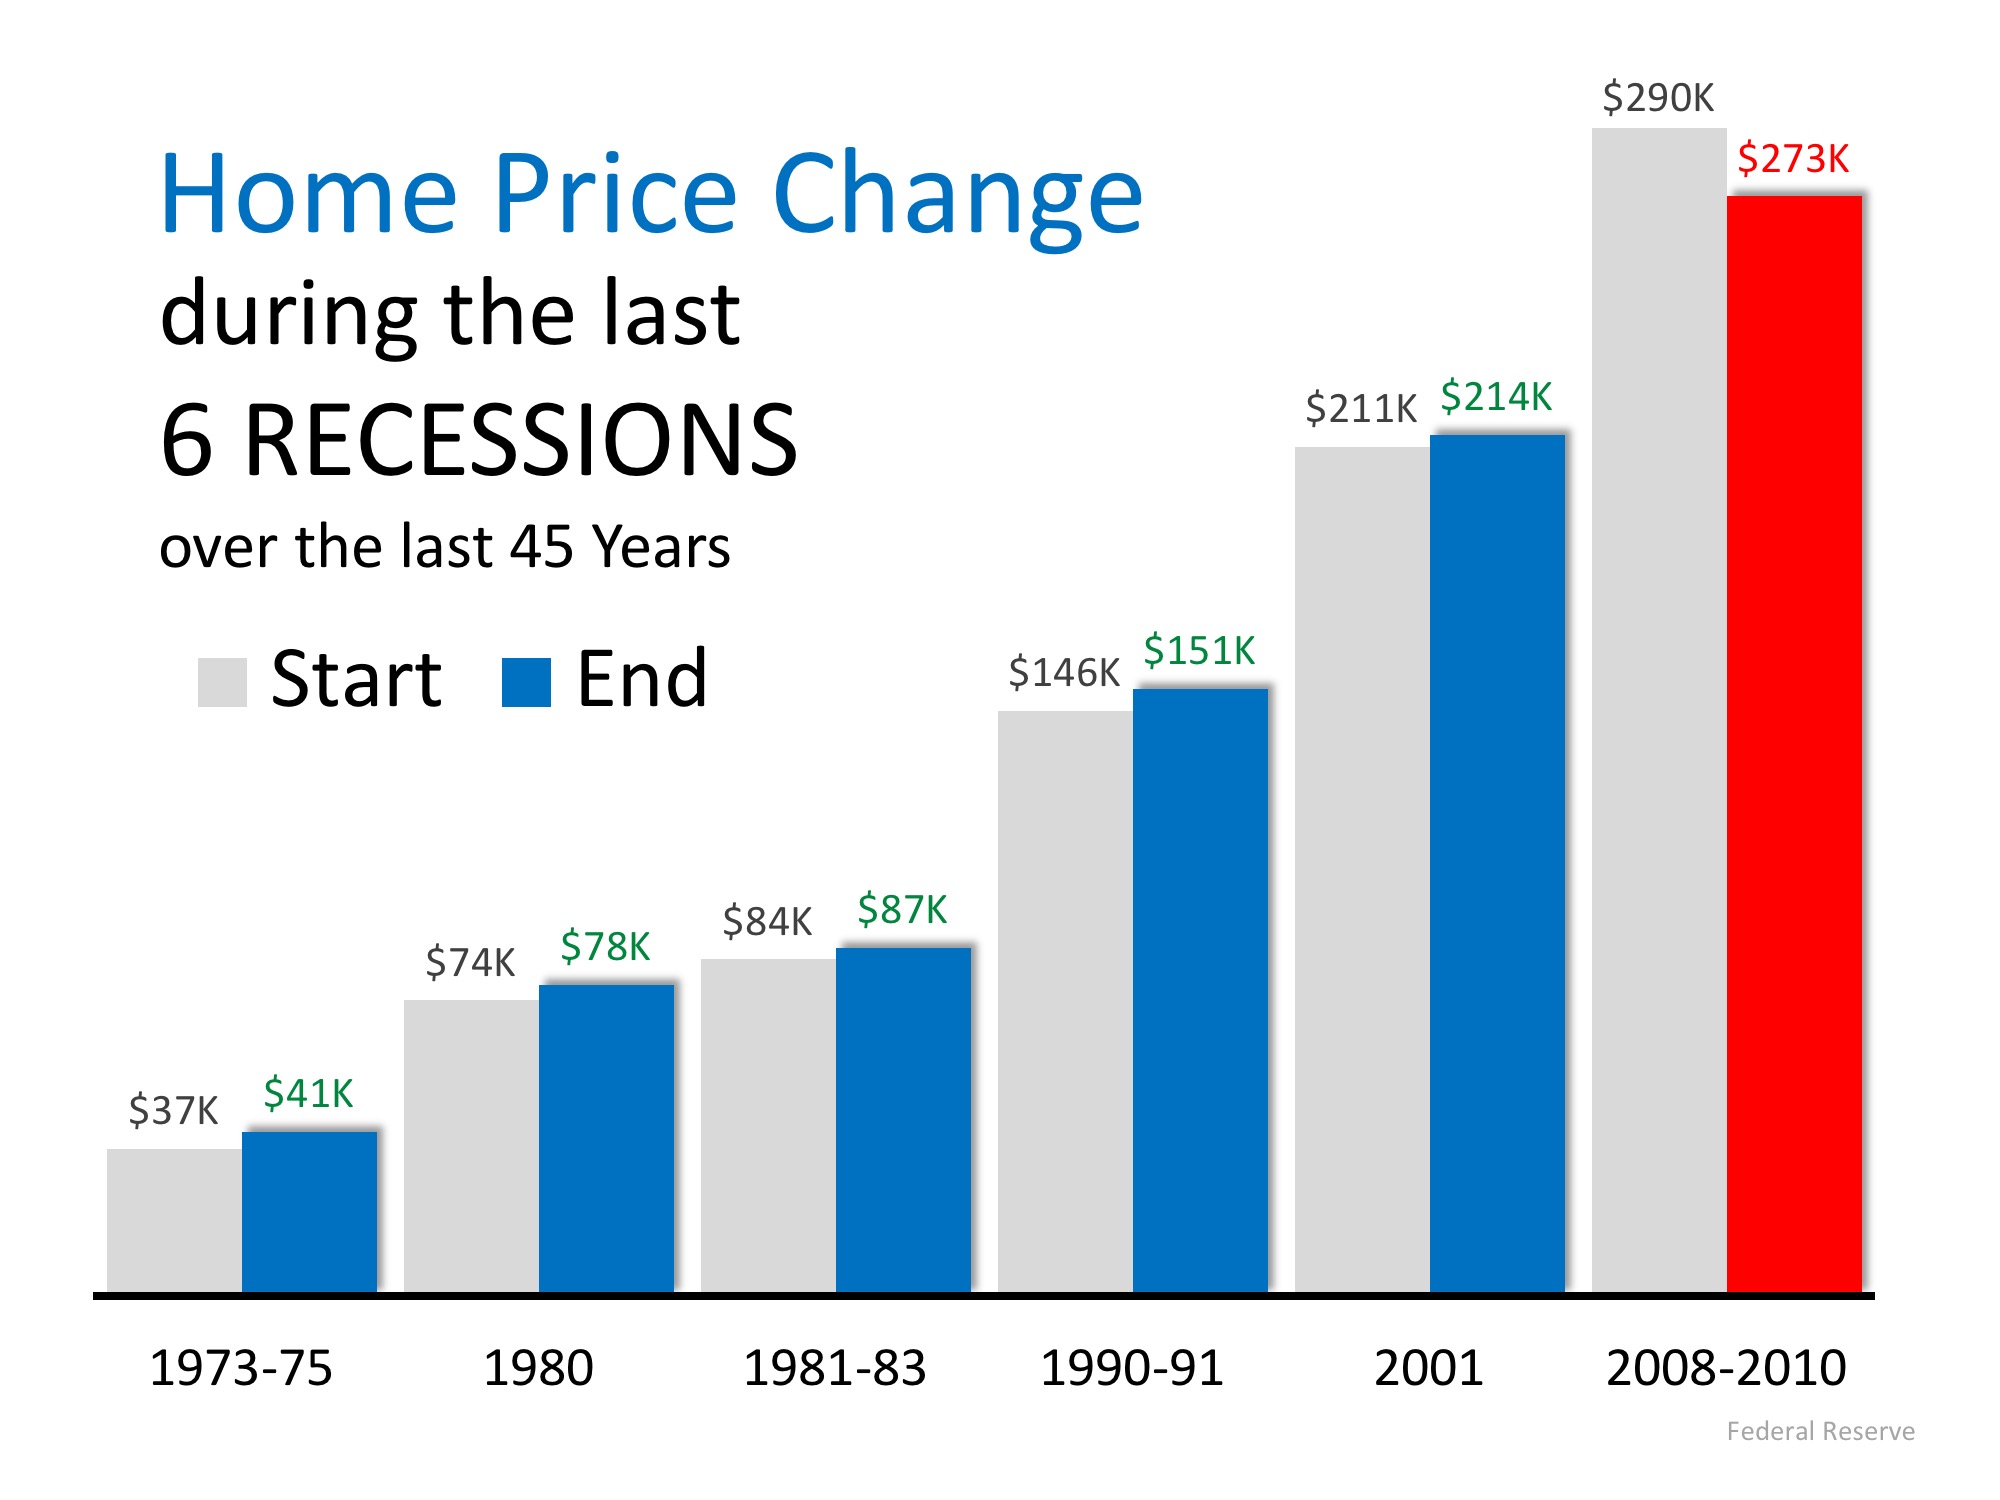
A recession means the economy has slowed down markedly. It does not mean we are experiencing another housing crisis. Obviously, the housing crash of 2008 caused the last recession. However, during the previous five recessions home values appreciated.
According to the experts surveyed by Pulsenomics, the top three probable triggers for the next recession are:
A housing market correction was ranked ninth in probability. Those same experts also projected that home values would continue to appreciate in 2019, 2020, 2021 and 2022.
Others agree that housing will not be impacted like it was a decade ago.
Mark Fleming, First American’s Chief Economist, explained:
“If a recession is to occur, it is unlikely to be caused by housing-related activity, and therefore the housing sector should be one of the leading sources to come out of the recession.”
And U.S. News and World Report agreed:
“Fortunately – and hopefully – the history of recessions and current issues that could harm the economy don’t lead many to believe the housing market crash will repeat itself in an upcoming decline.”
A recession is probably less than two years away. A housing crisis is not.
Posted in For Buyers, For Sellers, Housing Market Updates, Pricing

If you’ve entered the real estate market as a buyer or a seller, you’ve inevitably heard the mantra “location, location, location” in reference to identical homes increasing or decreasing in value based on where they’re located.
In today’s housing market where home prices are appreciating quickly, it’s important to know that not every home appreciates at the same rate. The map below demonstrates that point on a state-by-state basis using data from the National Association of Realtors.
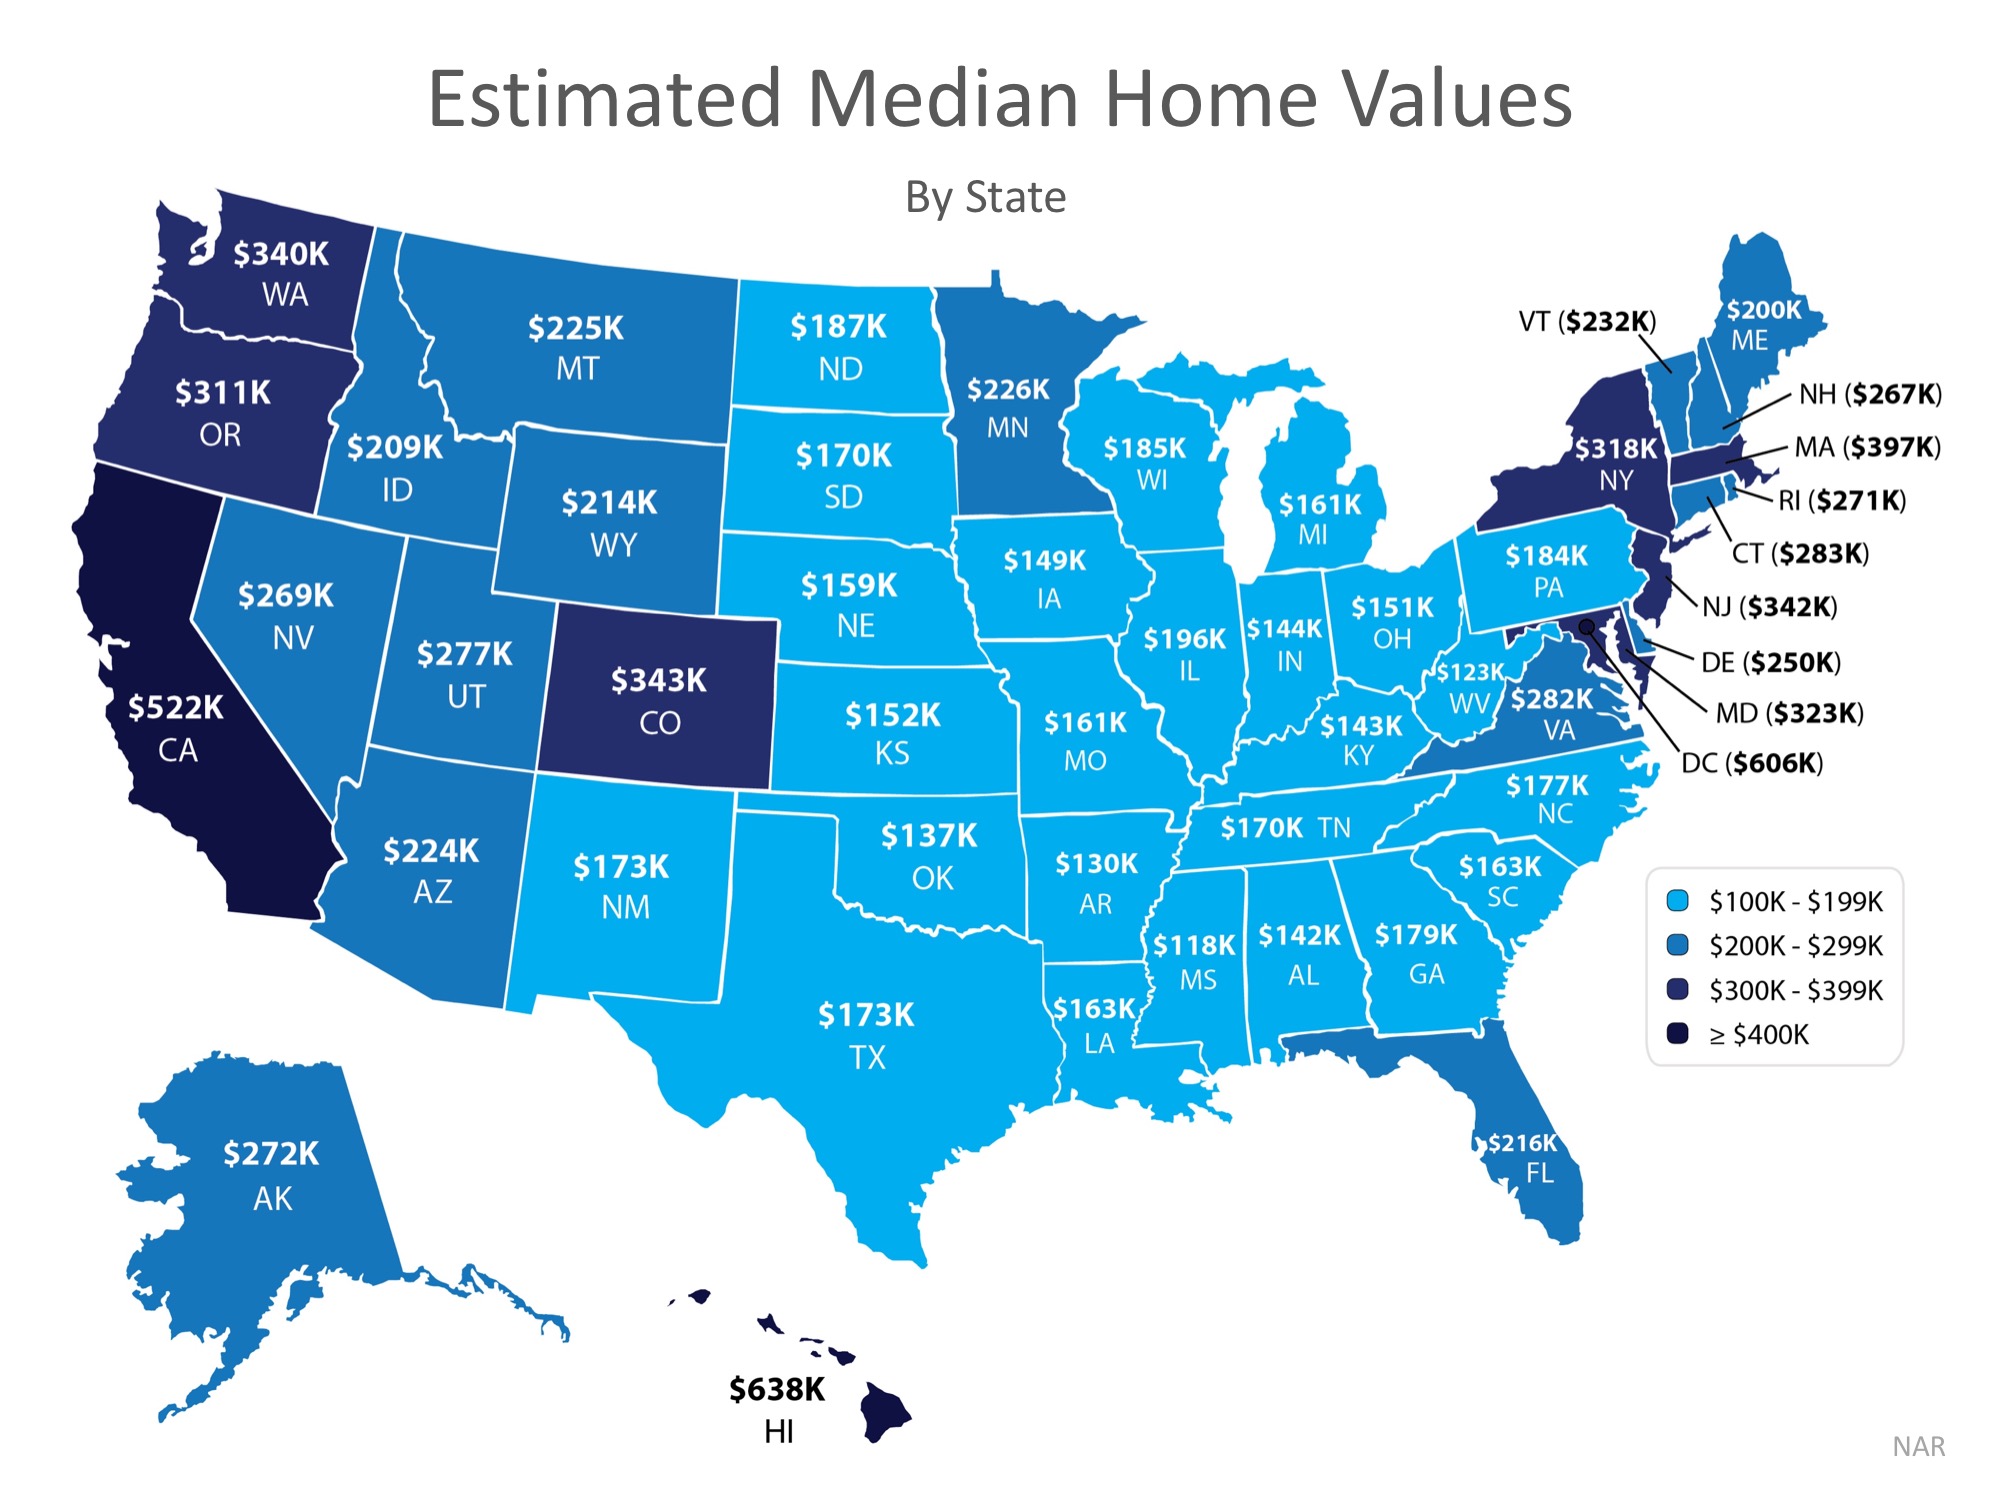
Demand often dictates value, even for houses in the same area of the country! High demand for starter and trade-up homes have driven prices up in these categories by nearly 10% over the past year, while those in the premium markets have appreciated at closer to 6%.
If you are debating whether or not to buy and/or sell a home this year, let’s get together to help you figure out exactly what’s going on in our market.
Posted in First Time Home Buyers, For Buyers, For Sellers, Move-Up Buyers, Pricing

With both home prices and mortgage rates increasing this year, many are concerned about a family’s ability to purchase a major part of the American Dream – its own home. However, if we compare housing affordability today to the average affordability prior to the housing boom and bust, we are in much better shape than most believe.
In Black Knight’s latest monthly Mortgage Monitor, they revealed that in the vast majority of the country, it is actually more affordable to purchase a home today than it was between 1995 to 2003 when looking at mortgage payments (determined by price and interest rate) as compared to incomes. Home prices are up compared to 1995-2003, but mortgage rates are still much lower now than at that time. Today, they stand at about 4.5%. Here are the average mortgage rates for each of the years mentioned:
On the other hand, wages have risen over the last twenty years.
Black Knight’s research revealed that, when comparing “the share of median income required to buy the median-priced home” today, to the average between 1995 to 2003, it is currently more affordable to purchase a home in 44 of 50 states.
Here is a state map of the percentage change in the price-to-payment ratio. Positive numbers indicate that it is less affordable to buy while negative numbers indicate that it is more affordable.

Whether you are moving up to the home of your dreams or purchasing your first house, it is a great time to buy when looking at historic affordability data.
Posted in First Time Home Buyers, For Buyers, Interest Rates, Move-Up Buyers, Pricing

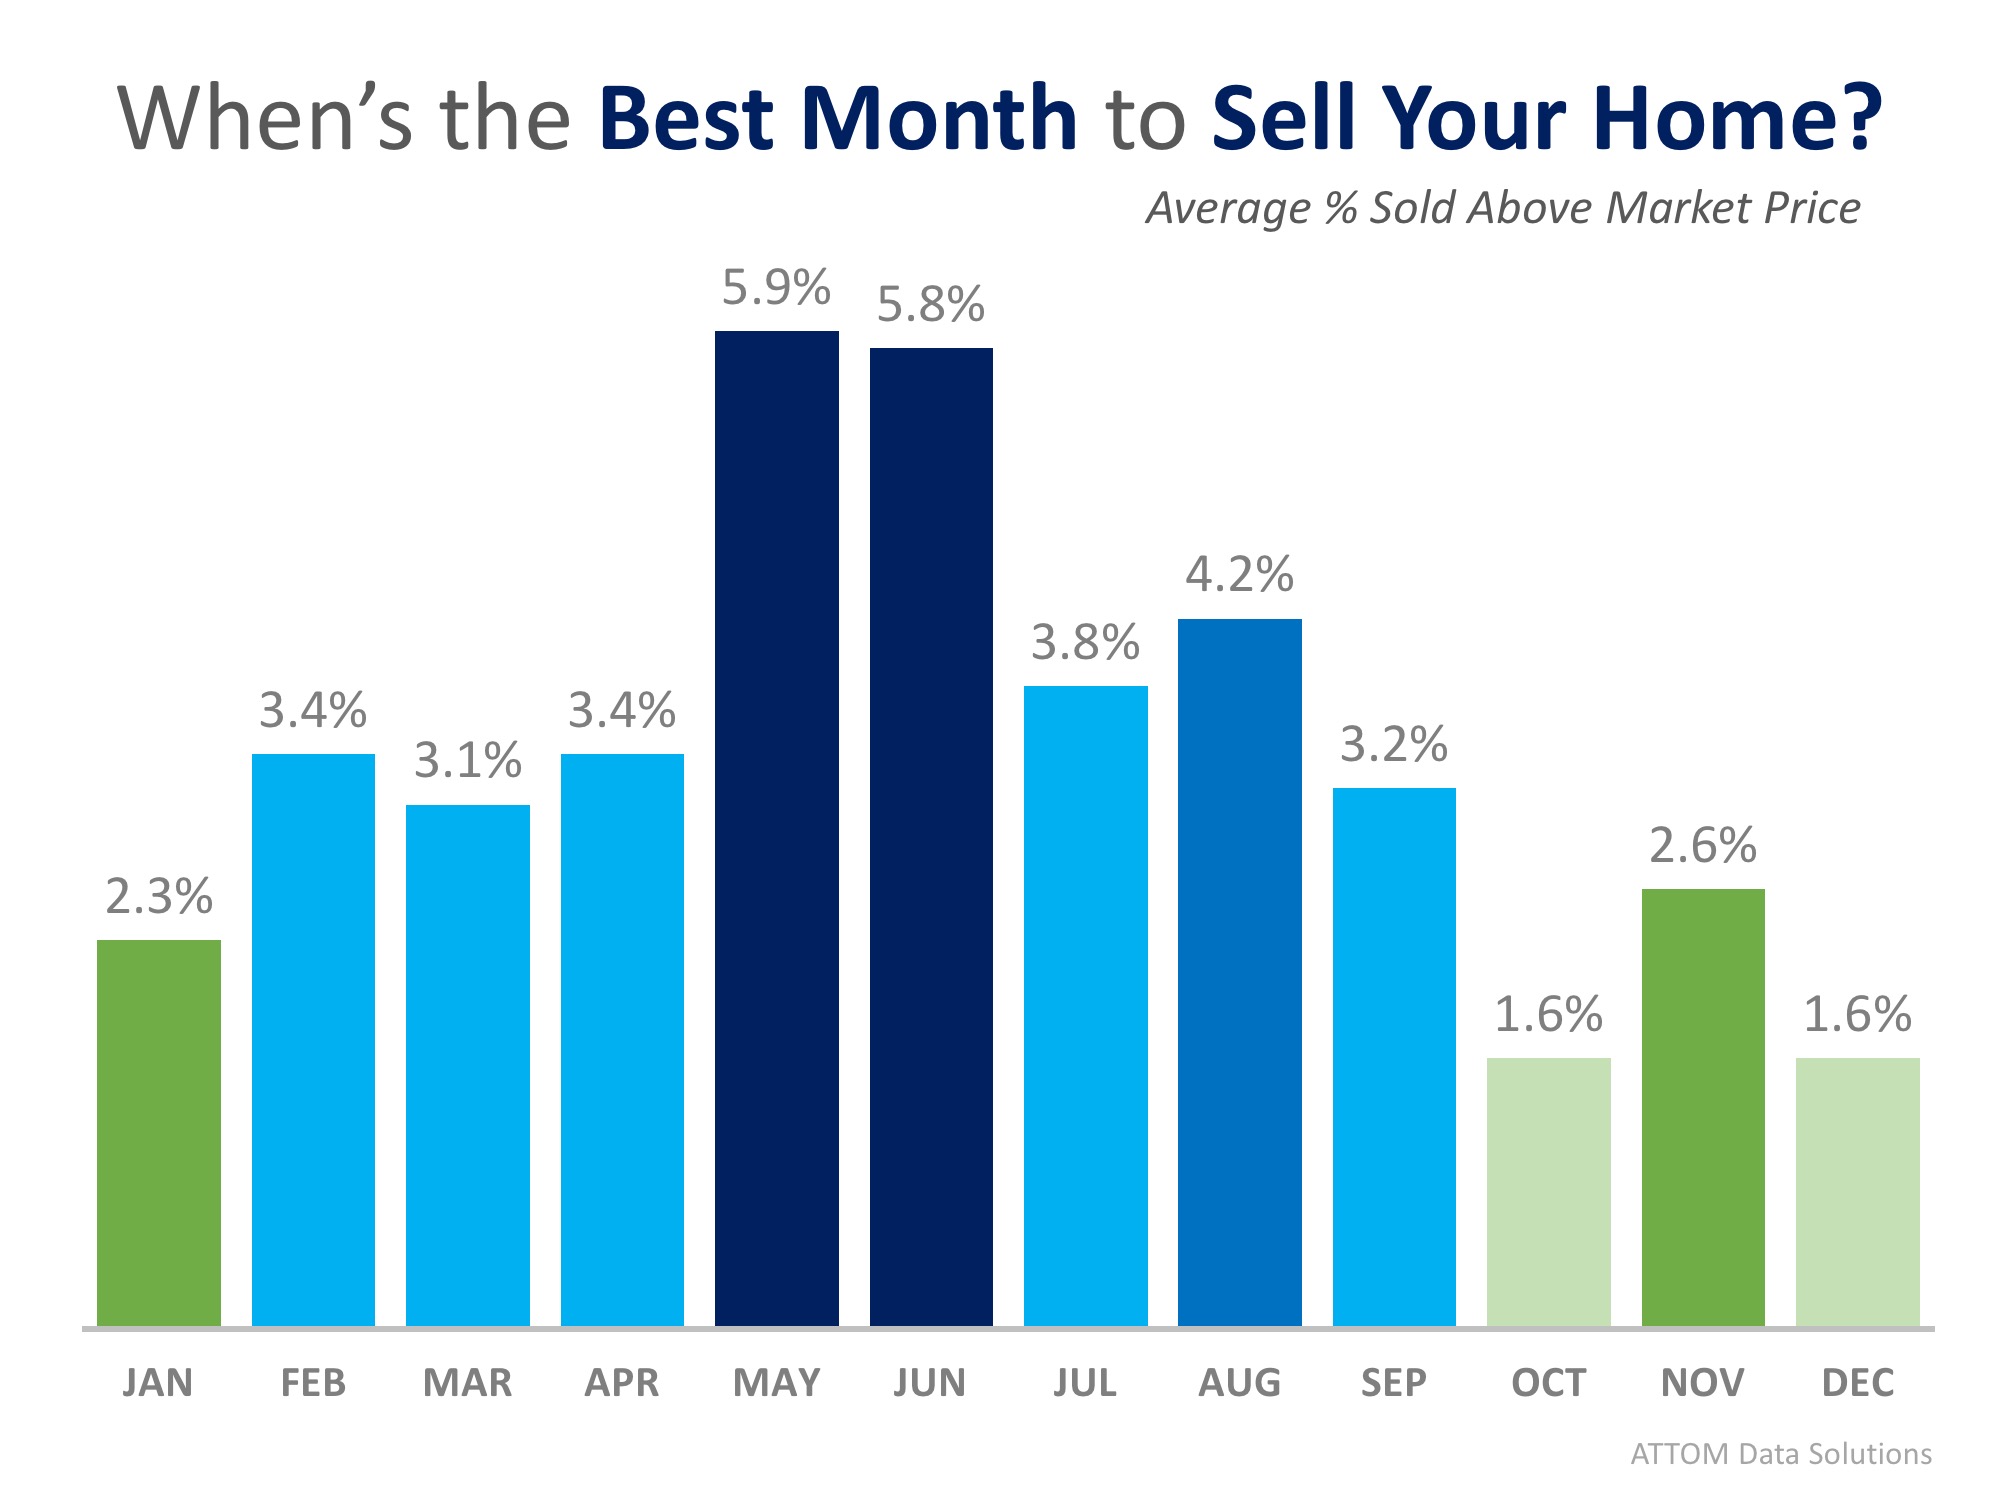
According to a newly released study by ATTOM Data Solutions, selling your home in the month of May will net you an average of 5.9% above estimated market value for your home.
For the study, ATTOM performed an “analysis of 14.7 million home sales from 2011 to 2017” and found the average seller premium achieved for each month of the year. Below is a breakdown by month:
ATTOM even went a step further and broke their results down by day.
It should come as no surprise that May and June dominate as the top months to sell and that 4 of the top 5 days to sell fall in those two months. The second quarter of the year (April, May, June) is referred to as the Spring Buyers Season, when competition is fierce to find a dream home, which often leads to bidding wars.
One caveat to mention though, is that when broken down by metro, ATTOM noticed that while warmer climates share in the overall trend, it turns out that they have different top months for sales. The best month to get the highest price in Miami, FL, for instance, was January, and Phoenix, AZ came in with November leading the charge.
If you’re thinking of selling your home this year, the time to list is NOW! According to the National Association of Realtors, homes sold in an average of just 30 days last month! If you list now, you’ll have a really good chance to sell in May or June, setting yourself up for getting the best price!
Let’s get together to discuss the market conditions in our area and get you the most exposure to the buyers who are ready and willing to buy!
Posted in For Sellers, Move-Up Buyers, Pricing
Recently, Freddie Mac published an Insight Report titled Nowhere to go but up? How increasing mortgage rates could affect housing. The report focused on the impact the projected rise in mortgage rates might have on the housing market this year.
Many believe that an increase in mortgage rates will cause a slowdown in purchases which would, in turn, lead to a fall in house values. Ultimately, however, prices are determined by supply and demand and while rising mortgage rates may slow demand, they also affect supply. From the report:
“For current homeowners, the decision to buy a new home is typically linked to their decision to sell their current home… Because of this link, the financing costs of the existing mortgage are part of the homeowner’s decision of whether and when to move.
Once financing costs for a new mortgage rise above the rate borrowers are paying for their current mortgage, borrowers would have to give up below-market financing to sell their home.
Instead, they may choose to delay both the sale of their existing home and the purchase of a new home to maintain the advantageous financing.”
The Freddie Mac report, in acknowledging this situation, concluded that prices are not adversely impacted by higher mortgage rates. They explained:
“While there is a drop in the demand for homes, there is an associated drop in the supply of homes from the link between the selling and buying decisions. As both supply and demand move together in this way they have offsetting effects on price—lower demand decreases price and lower supply increases price.
They went on to reveal that the Freddie Mac National House Price Index is…
“…unresponsive to movements in interest rates. In the current housing market, the driving force behind the increase in prices is a low supply of both new and existing homes combined with historically low rates. As mortgage rates increase, the demand for home purchases will likely remain strong relative to the constrained supply and continue to put upward pressure on home prices.”
The following graph, based on data from the report, reveals what happened to home prices the last six times mortgage rates rose by at least 1%.
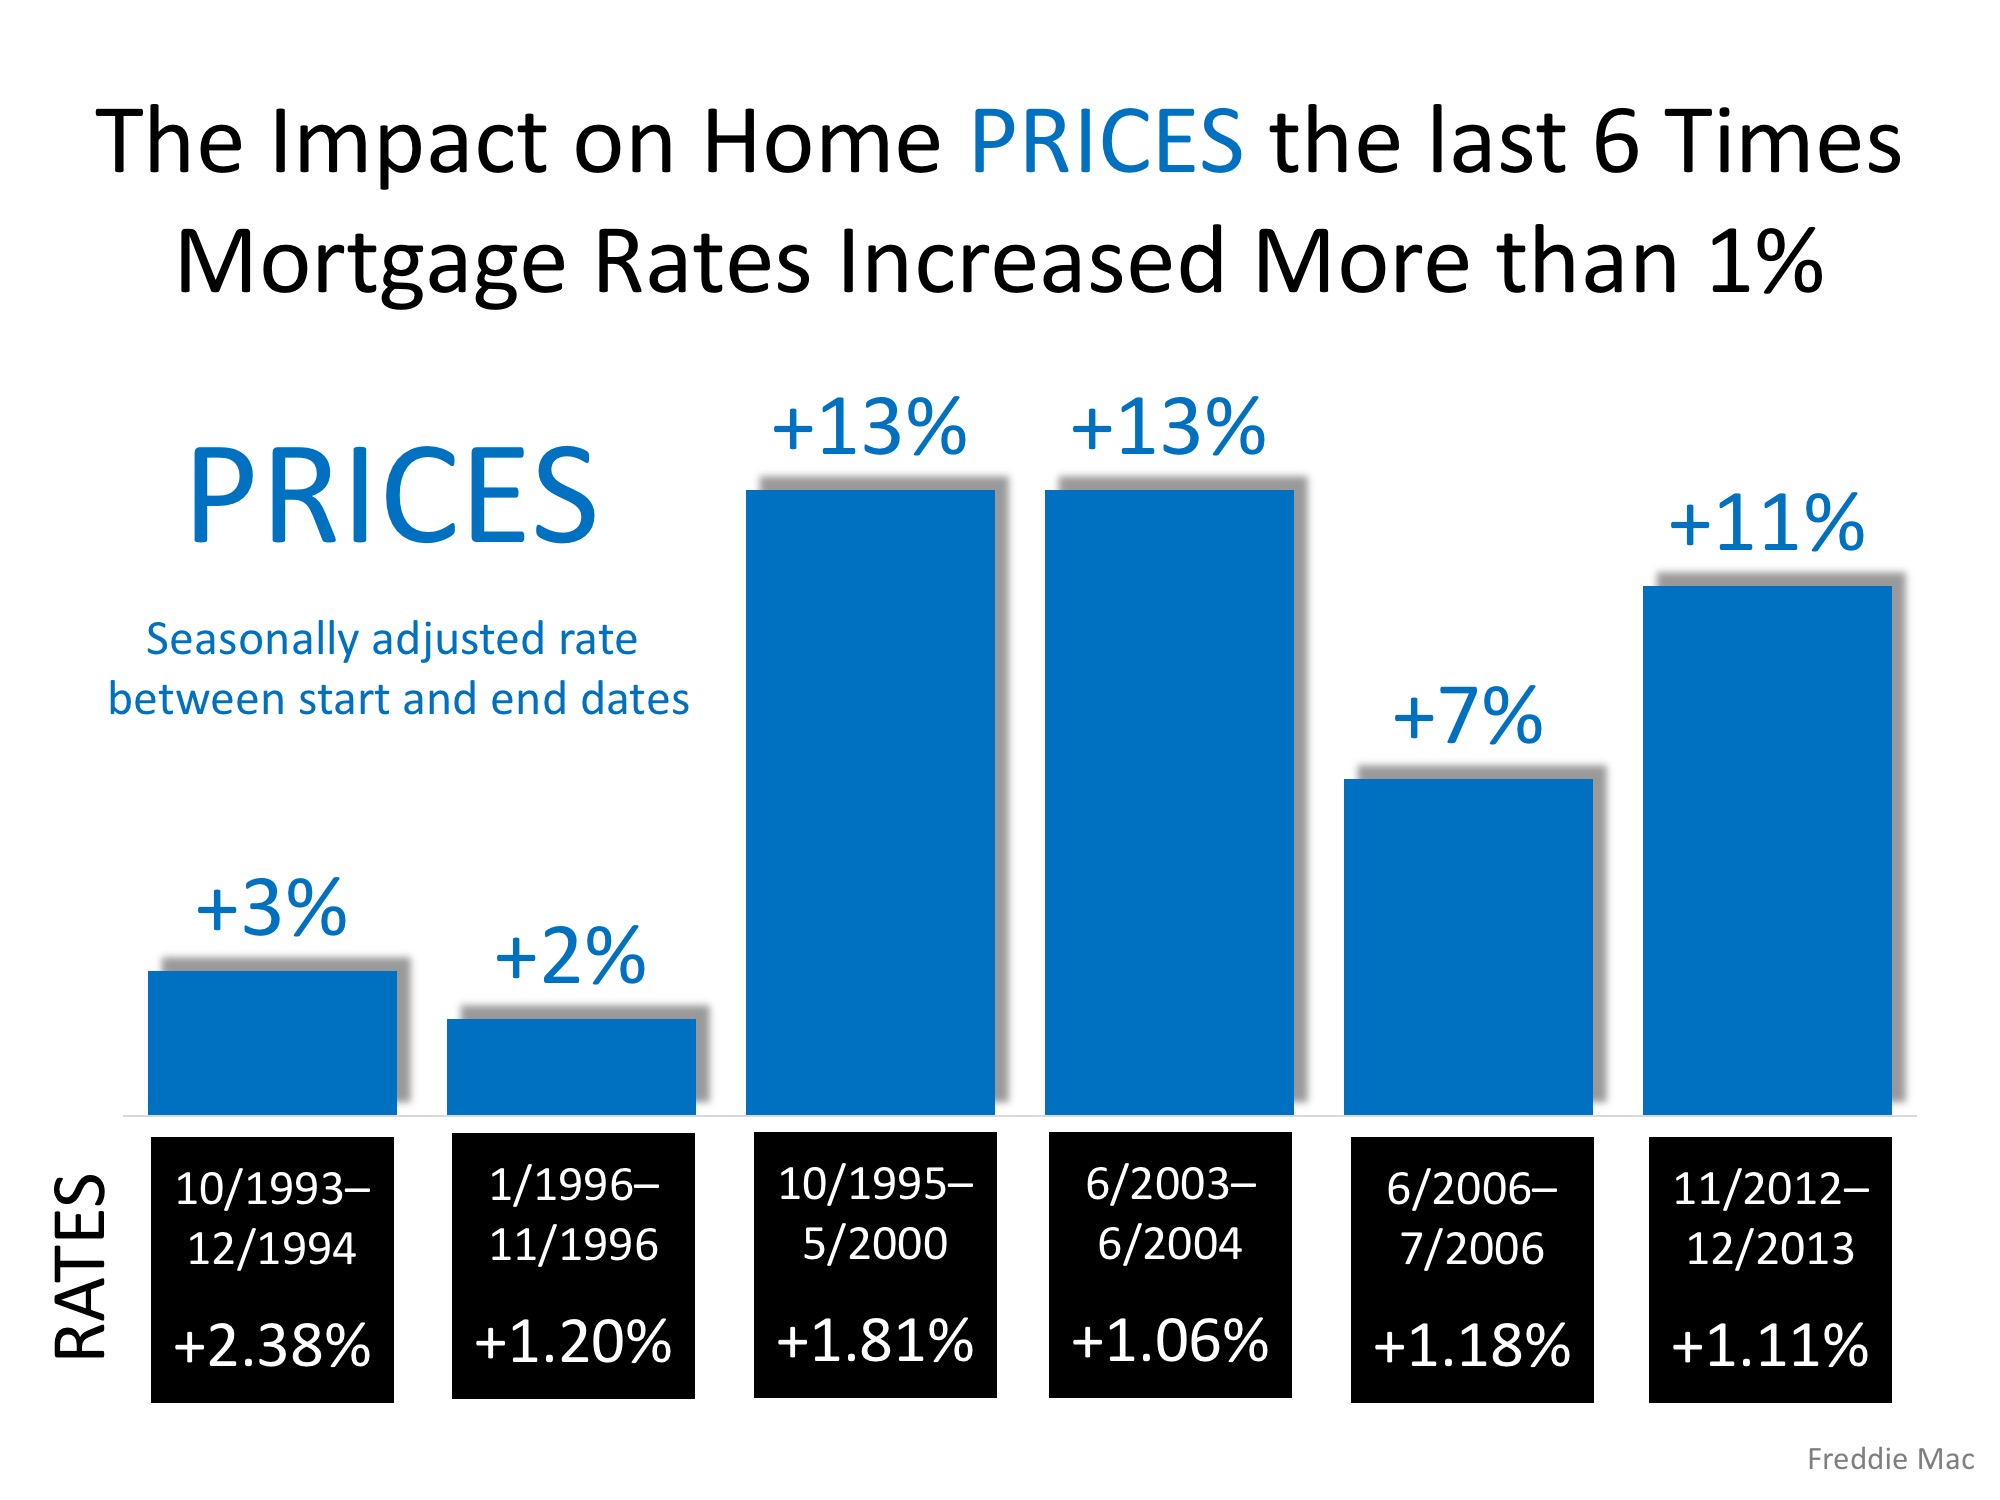
Whether you are a move-up buyer or first-time buyer, waiting to purchase your next home based on the belief that prices will fall because of rising mortgage rates makes no sense.
Posted in Buying Myths, First Time Home Buyers, For Buyers, Housing Market Updates, Interest Rates, Move-Up Buyers, Pricing
For your home value estimate, enter the access code you received on the postcard, just click here: