Category: Infographics
November 23rd, 2018 by Lum Hugh
![Existing Home Sales Slowed by a Lack of Listings [INFOGRAPHIC] | Simplifying The Market](https://files.simplifyingthemarket.com/wp-content/uploads/2018/11/21112153/20181122-Share-STM1.jpg)
Some Highlights:
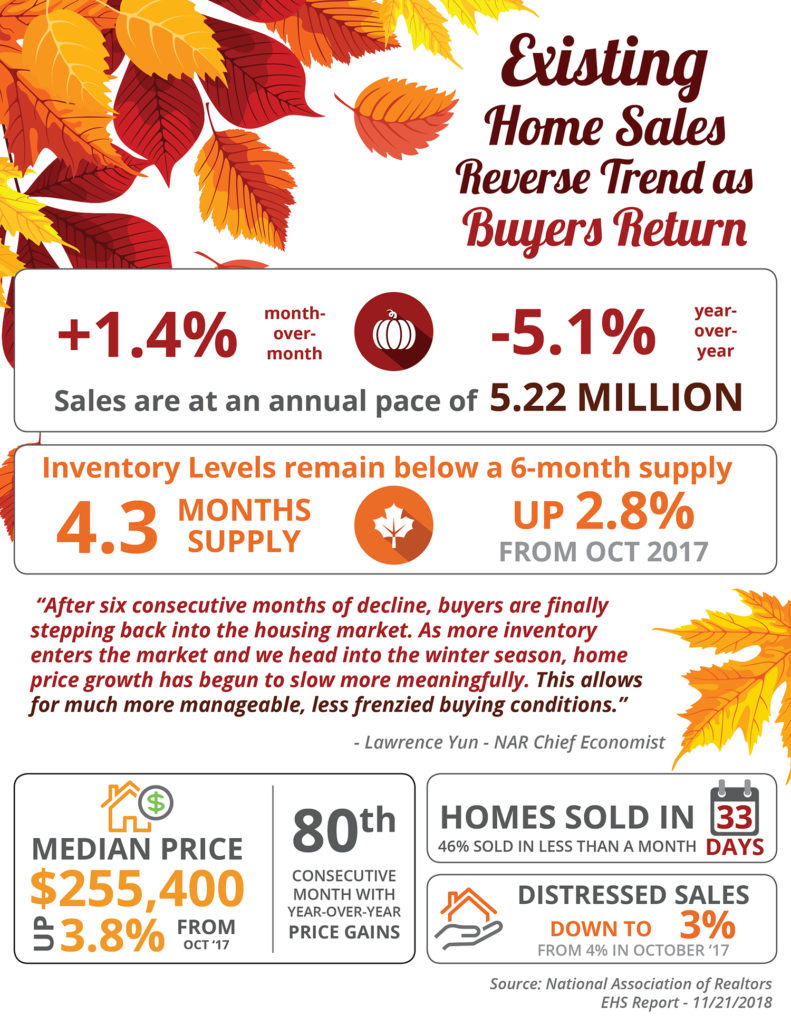
- Existing home sales are currently at an annual pace of 5.22 million, which is up 1.4% over last month. This reverses the six-month trend of dips in sales every month.
- The inventory of existing homes is still below the 6-month supply needed for a normal market and is now at a 4.3-month supply.
- NAR’s Chief Economist, Lawrence Yun, had this to say: “After six consecutive months of decline, buyers are finally stepping back into the housing market. As more inventory enters the market and we head into the winter season, home price growth has begun to slow more meaningfully. This allows for much more manageable, less frenzied buying conditions.”
Posted in For Buyers, For Sellers, Housing Market Updates, Infographics
October 26th, 2018 by Lum Hugh
![Buying a Home Can Be Scary... Until You Know the Facts [INFOGRAPHIC] | Simplifying The Market](https://files.simplifyingthemarket.com/wp-content/uploads/2018/10/17130315/20181026-Share-STM.jpg)

Some Highlights:
Many potential homebuyers believe that they need a 20% down payment and a 780 FICO® score to qualify to buy a home which stops many of them from even trying! Here are some facts:
- 72% of buyers who purchased homes this year have put down less than 20%.
- 76.4% of loan applications were approved last month.
- The average credit score of approved loans was 727 in September.
Posted in Buying Myths, First Time Home Buyers, For Buyers, Infographics
October 19th, 2018 by Lum Hugh
![20 Tips for Preparing Your House for Sale This Fall [INFOGRAPHIC] | Simplifying The Market](https://files.simplifyingthemarket.com/wp-content/uploads/2018/10/11103717/20181019-Share-STM.jpg)

Some Highlights:
- When listing your house for sale, your top goal will be to get the home sold for the best price possible!
- There are many small projects that you can do to ensure this happens!
- Let’s get together to discuss a list of specific suggestions for getting your house ready for market & potential local contractors who can help!
Posted in For Sellers, Infographics
September 28th, 2018 by Lum Hugh


Some Highlights:
- The cost of waiting to buy is defined as the additional funds it would take to buy a home if prices & interest rates were to increase over a period of time.
- Freddie Mac predicts interest rates to rise to 5.2% by the third quarter of 2019.
- CoreLogic predicts home prices to appreciate by 5.1% over the next 12 months.
- If you are ready and willing to buy your dream home, find out if you are able to!
Posted in First Time Home Buyers, For Buyers, Infographics, Interest Rates, Millennials, Move-Up Buyers, Pricing
August 31st, 2018 by Lum Hugh
![A+ Reasons to Hire a Real Estate Pro [INFOGRAPHIC] | Simplifying The Market](http://files.simplifyingthemarket.com/wp-content/uploads/2018/08/21152250/20180831-Share-STM.jpg)

Some Highlights:
- Hiring a real estate professional to help you buy your dream home or sell your current house is one of the most ‘educated’ decisions you can make!
- A real estate professional has the experience needed to help you through the entire process.
- Make sure that you hire someone who knows current market conditions and can simply and effectively explain them to you and your family!
Posted in For Buyers, For Sellers, FSBOs, Infographics
July 27th, 2018 by Lum Hugh
![Americans Rank Real Estate Best Investment for 5 Years Running! [INFOGRAPHIC] | Simplifying The Market](http://files.simplifyingthemarket.com/wp-content/uploads/2018/07/18142501/20180727-Share-STM.jpg)

Some Highlights:
- Real estate has outranked stocks/mutual funds, gold, savings accounts/CDs, and bonds as the best long-term investment among Americans for the last 5 years!
- The generations agree! Real estate is the best investment!
- Generation X leads the way with 37% believing in real estate as the top investment.
Posted in Baby Boomers, First Time Home Buyers, For Buyers, Generation X, Infographics, Millennials, Move-Up Buyers, Rent vs. Buy
July 20th, 2018 by Lum Hugh
![What You Need to Know About the Mortgage Process [INFOGRAPHIC] | Simplifying The Market](http://files.simplifyingthemarket.com/wp-content/uploads/2018/07/17145720/20180720-Share-STM.jpg)

Some Highlights:
- Many buyers are purchasing a home with a down payment as little as 3%.
- You may already qualify for a loan, even if you don’t have perfect credit.
- Take advantage of the knowledge of your local professionals who are there to help you determine how much you can afford.
Posted in Buying Myths, Down Payments, First Time Home Buyers, For Buyers, Infographics, Move-Up Buyers
June 29th, 2018 by Lum Hugh

![5 Reasons Millennials Choose to Buy a Home [INFOGRAPHIC] | Simplifying The Market](http://files.simplifyingthemarket.com/wp-content/uploads/2018/06/26162117/20180629-STM-ENG.jpg)
Some Highlights:
- “The majority of millennials said they consider owning a home more sensible than renting for both financial and lifestyle reasons — including control of living space, flexibility in future decisions, privacy and security, and living in a nice home.”
- The top reason millennials choose to buy is to have control over their living space, at 93%.
- Many millennials who rent a home or apartment prior to buying their own homes dream of the day when they will be able to paint the walls whatever color they’d like or renovate an outdated part of their living space.
Posted in First Time Home Buyers, For Buyers, Infographics, Millennials, Rent vs. Buy
June 22nd, 2018 by Lum Hugh


Some Highlights:
- Buyer demand continues to outpace the supply of homes for sale which means that buyers are often competing with one another for the few listings that are available!
- Housing inventory is still under the 6-month supply needed to sustain a normal housing market.
- Perhaps the time has come for you and your family to move on and start living the life you desire.
Posted in For Sellers, Infographics, Move-Up Buyers
May 25th, 2018 by Lum Hugh
![Drop in Inventory Fuels Sales Slowdown [INFOGRAPHIC] | Simplifying The Market](http://files.simplifyingthemarket.com/wp-content/uploads/2018/05/24164608/20180525-Share-STM.jpg)
![Drop in Inventory Fuels Sales Slowdown [INFOGRAPHIC] | Simplifying The Market](http://files.simplifyingthemarket.com/wp-content/uploads/2018/05/24164546/EHS-APR-STM-ENG.jpg)
Some Highlights:
- Existing Home Sales are now at an annual pace of 5.46 million.
- Inventory of existing homes for sale dropped to a 4-month supply, marking the 35th month in a row of declines.
- The median price of homes sold in April was $257,900. This is the 74th consecutive month of year-over-year price gains.
Posted in For Buyers, For Sellers, Infographics
