Category: Infographics
March 16th, 2018 by Lum Hugh
![The Cost of Waiting: Interest Rates Edition [INFOGRAPHIC] | Simplifying The Market](http://files.simplifyingthemarket.com/wp-content/uploads/2018/03/09132142/20180316-Share-STM.jpg)
Some Highlights:
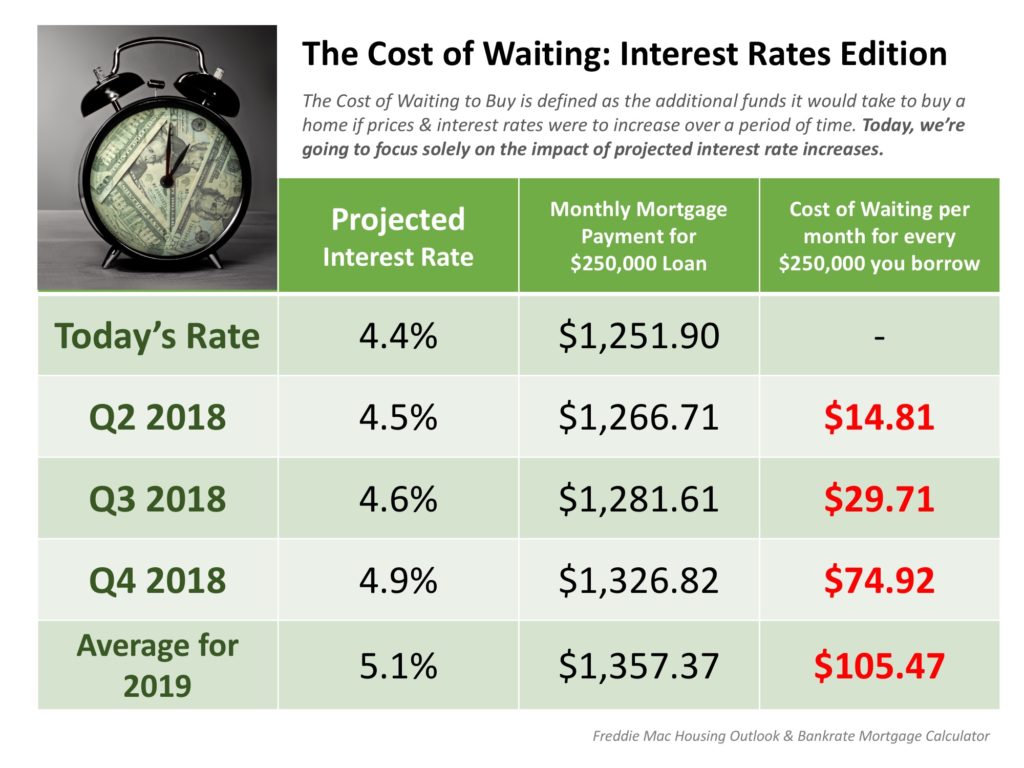
- Interest rates are projected to increase steadily heading into 2019.
- The higher your interest rate, the more money you end up paying for your home and the higher your monthly payment will be.
- Rates are still low right now. Don’t wait until rates hit 5% to start searching for your dream home!
Posted in First Time Home Buyers, For Buyers, Infographics, Interest Rates, Move-Up Buyers
February 23rd, 2018 by Lum Hugh
![The Mortgage Process: What You Need to Know [INFOGRAPHIC] | Simplifying The Market](http://files.simplifyingthemarket.com/wp-content/uploads/2018/02/15072558/20180223-Share-STM.jpg)

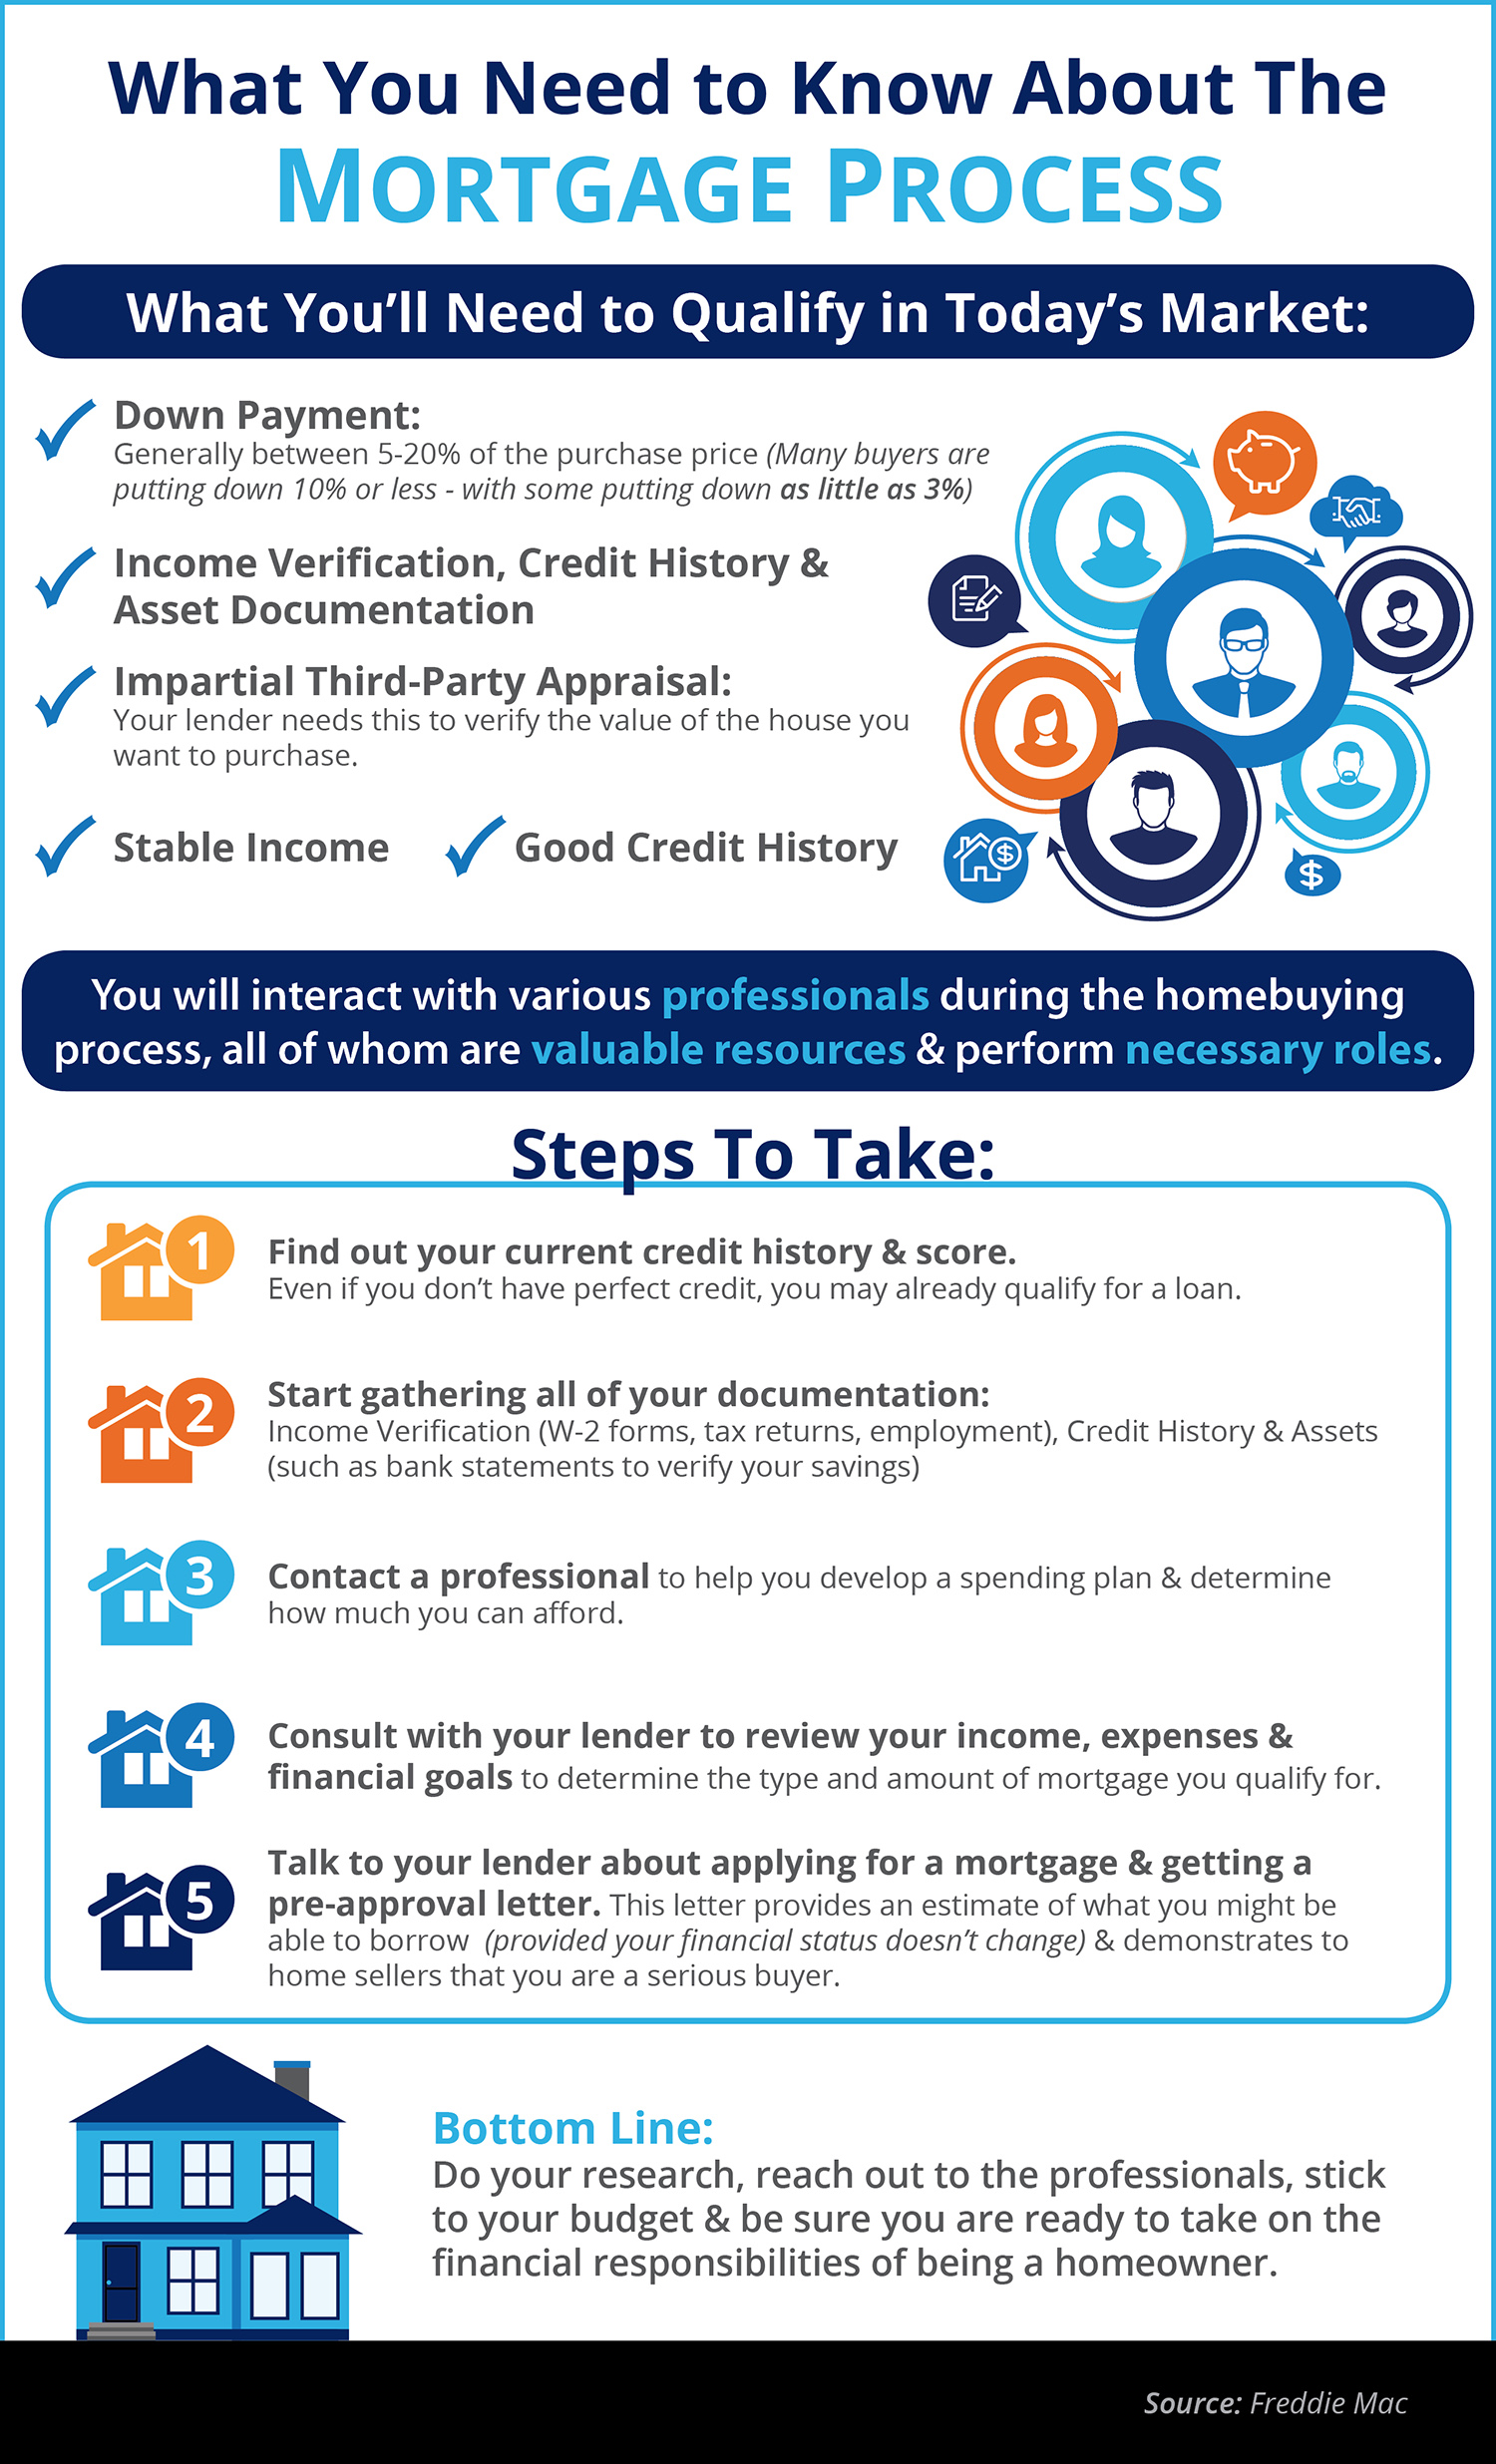
Some Highlights:
- Many buyers are purchasing a home with a down payment as little as 3%.
- You may already qualify for a loan, even if you don’t have perfect credit.
- Take advantage of the knowledge of your local professionals who are there to help you determine how much you can afford.
Posted in Buying Myths, First Time Home Buyers, For Buyers, Infographics, Move-Up Buyers
February 16th, 2018 by Lum Hugh

Some Highlights:
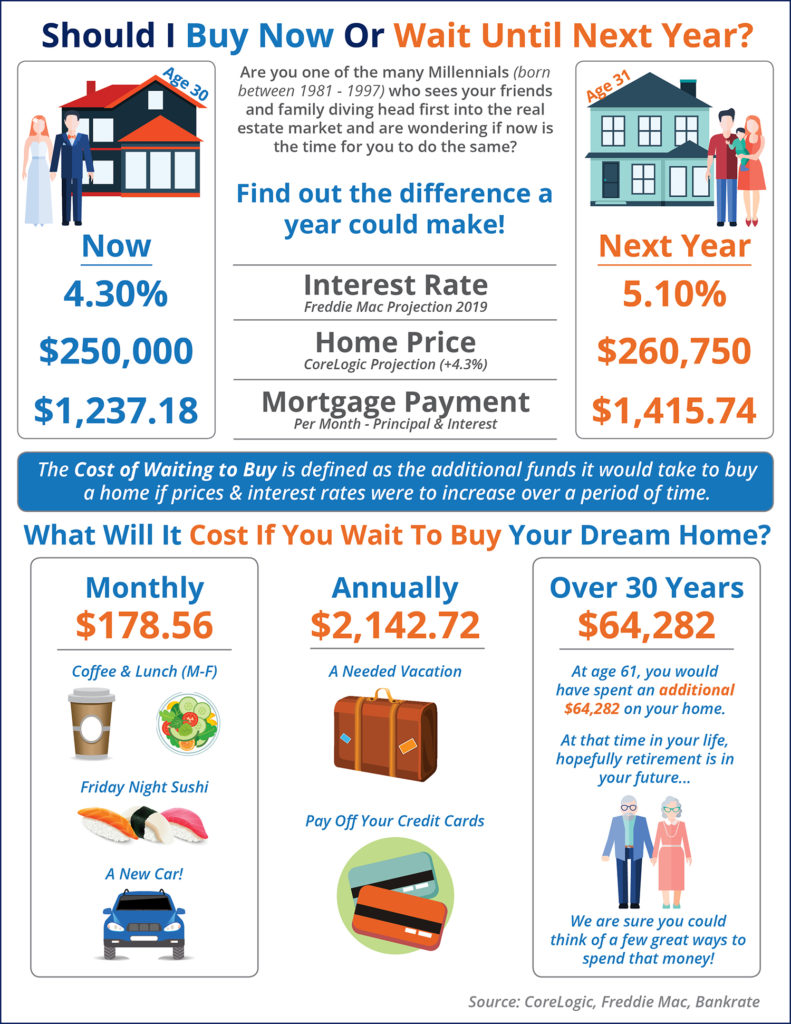
- The Cost of Waiting to Buy is defined as the additional funds it would take to buy a home if prices & interest rates were to increase over a period of time.
- Freddie Mac predicts interest rates to rise to 5.1% by 2019.
- CoreLogic predicts home prices to appreciate by 4.3% over the next 12 months.
- If you are ready and willing to buy your dream home, find out if you are able to!
Posted in First Time Home Buyers, For Buyers, Infographics, Interest Rates, Millennials, Move-Up Buyers, Pricing
February 2nd, 2018 by Lum Hugh
![5 Reasons Homeowners Can Throw Better Super Bowl Parties! [INFOGRAPHIC] | Simplifying The Market](http://files.simplifyingthemarket.com/wp-content/uploads/2018/01/25125455/20180202-Share-STM.jpg)

Highlights:
- Watching the big game at home with your friends & family offers many advantages.
- There’s more room to entertain a large crowd and you don’t have to worry about complaints to your landlord if you cheer too loudly!
- The kitchen is big enough to make as many appetizers as you want, and if some of your guests are only there to watch the commercials, they can do so on a different TV in another room!
Posted in First Time Home Buyers, For Buyers, Infographics, Move-Up Buyers
January 26th, 2018 by Lum Hugh


Some Highlights:
- “The majority of millennials said they consider owning a home more sensible than renting for both financial and lifestyle reasons — including control of living space, flexibility in future decisions, privacy and security, and living in a nice home.”
- The top reason millennials choose to buy is to have control over their living space, at 93%.
- Many millennials who rent a home or apartment prior to buying their own homes dream of the day when they will be able to paint the walls whatever color they’d like, or renovate an outdated part of their living space.
Posted in First Time Home Buyers, For Buyers, Infographics, Millennials
January 19th, 2018 by Lum Hugh
![Where Did Americans Move in 2017? [INFOGRAPHIC] | Simplifying The Market](http://files.simplifyingthemarket.com/wp-content/uploads/2018/01/09171302/20180119-STM-Share.jpg)
Some Highlights:
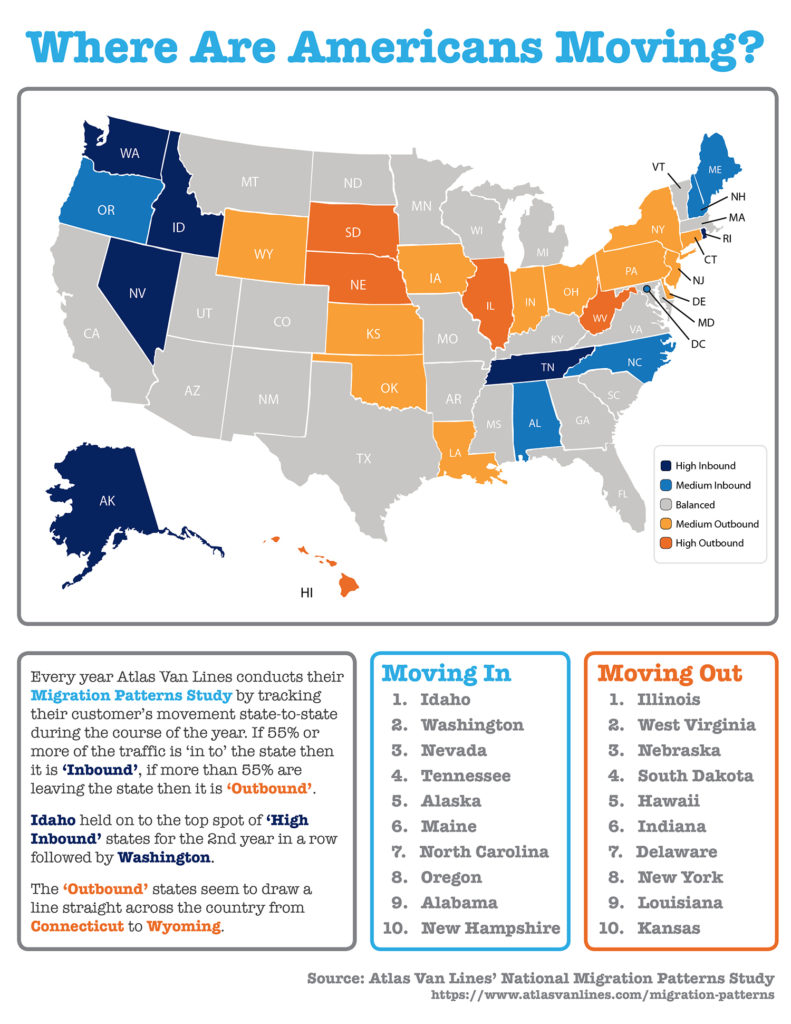
- Atlas Van Lines recently released the results of their annual Migration Patterns Survey in which they tracked their customer’s movement from state-to-state over the course of 2017.
- Idaho held on to the top spot of ‘high inbound’ states for the 2nd year in a row followed by Washington.
- The ‘outbound’ states seem to draw a line straight across the country from Connecticut to Wyoming.
Posted in First Time Home Buyers, For Buyers, For Sellers, Housing Market Updates, Infographics, Move-Up Buyers
January 12th, 2018 by LHugh
Some Highlights:
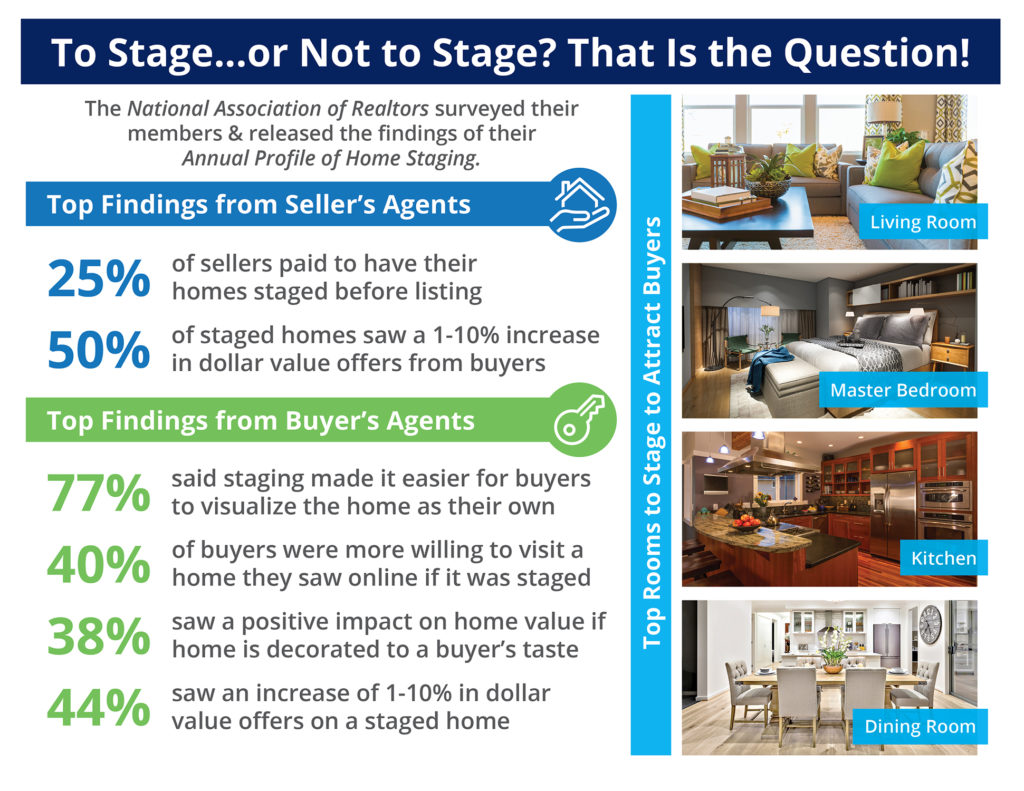
- The National Association of Realtors surveyed their members & released the findings of their Annual Profile of Home Staging.
- 50% of staged homes saw a 1-10% increase in dollar value offers from buyers.
- 77% of buyer’s agents said staging made it easier for buyers to visualize the home as their own.
- The top rooms to stage in order to attract more buyers are the living room, master bedroom, kitchen, and dining room.
Posted in For Buyers, Infographics, Move-Up Buyers
January 5th, 2018 by LHugh

Some Highlights:
- Buyer demand continues to outpace the supply of homes for sale which means that buyers are often competing with one another for the few listings that are available!
- Housing inventory is still under the 6-month supply needed to sustain a normal housing market.
- Perhaps the time has come for you and your family to move on and start living the life you desire.
Posted in For Buyers, For Sellers, Infographics, Move-Up Buyers
December 29th, 2017 by Lum Hugh
![Buying or Selling in 2018? 5 Reasons to Resolve to Hire a Pro [INFOGRAPHIC] | Simplifying The Market](http://files.simplifyingthemarket.com/wp-content/uploads/2017/12/19171354/20171229-Share-STM.jpg)

Some Highlights:
- As we usher in the new year, one thing is for certain… if you plan to buy or sell a house this year, you need a real estate professional on your team!
- There are many benefits to using a local professional!
- Pick a professional who knows your local market and can help you achieve your dreams!
Posted in First Time Home Buyers, For Buyers, For Sellers, Infographics, Move-Up Buyers
December 22nd, 2017 by Lum Hugh


Some Highlights:
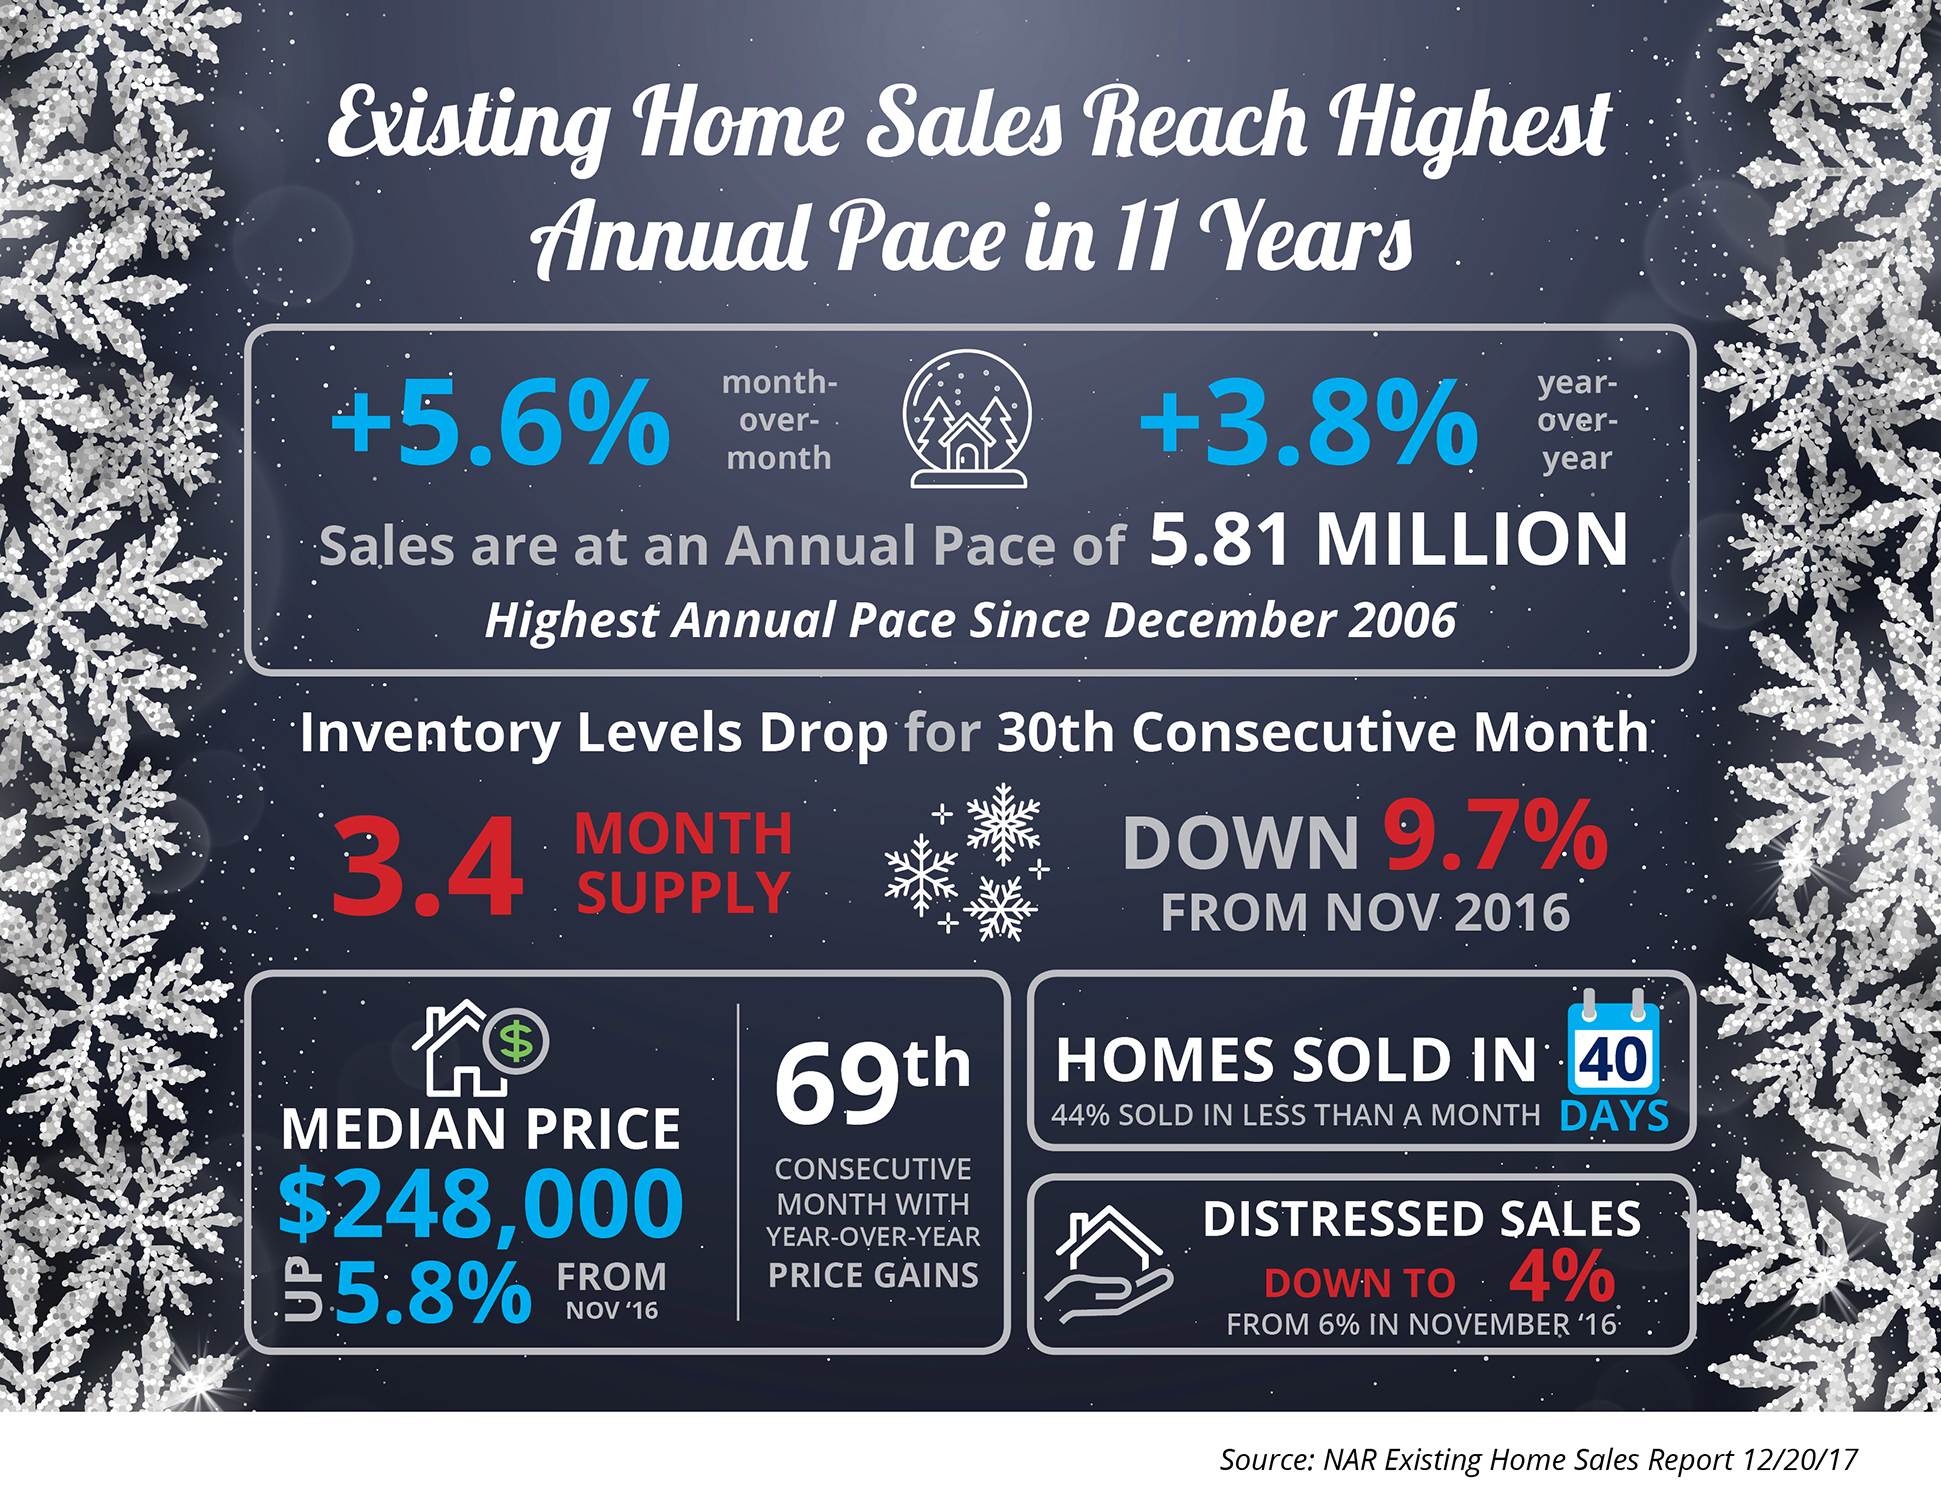
- Existing home sales are currently at an annual pace of 5.81 million, the highest pace since December 2006.
- The inventory of existing homes for sale has dropped year-over-year for the last 30 consecutive months and is now at a 3.4-month supply.
- NAR’s Chief Economist Lawrence Yun had this to say: “Faster economic growth in recent quarters, the booming stock market and continuous job gains are fueling substantial demand for buying a home as 2017 comes to an end.”
Posted in First Time Home Buyers, For Buyers, For Sellers, Housing Market Updates, Infographics, Move-Up Buyers