Category: For Sellers
What’s the Median Home Value in Your State?
Jun
27
2018

If you’ve entered the real estate market as a buyer or a seller, you’ve inevitably heard the mantra “location, location, location” in reference to identical homes increasing or decreasing in value based on where they’re located.
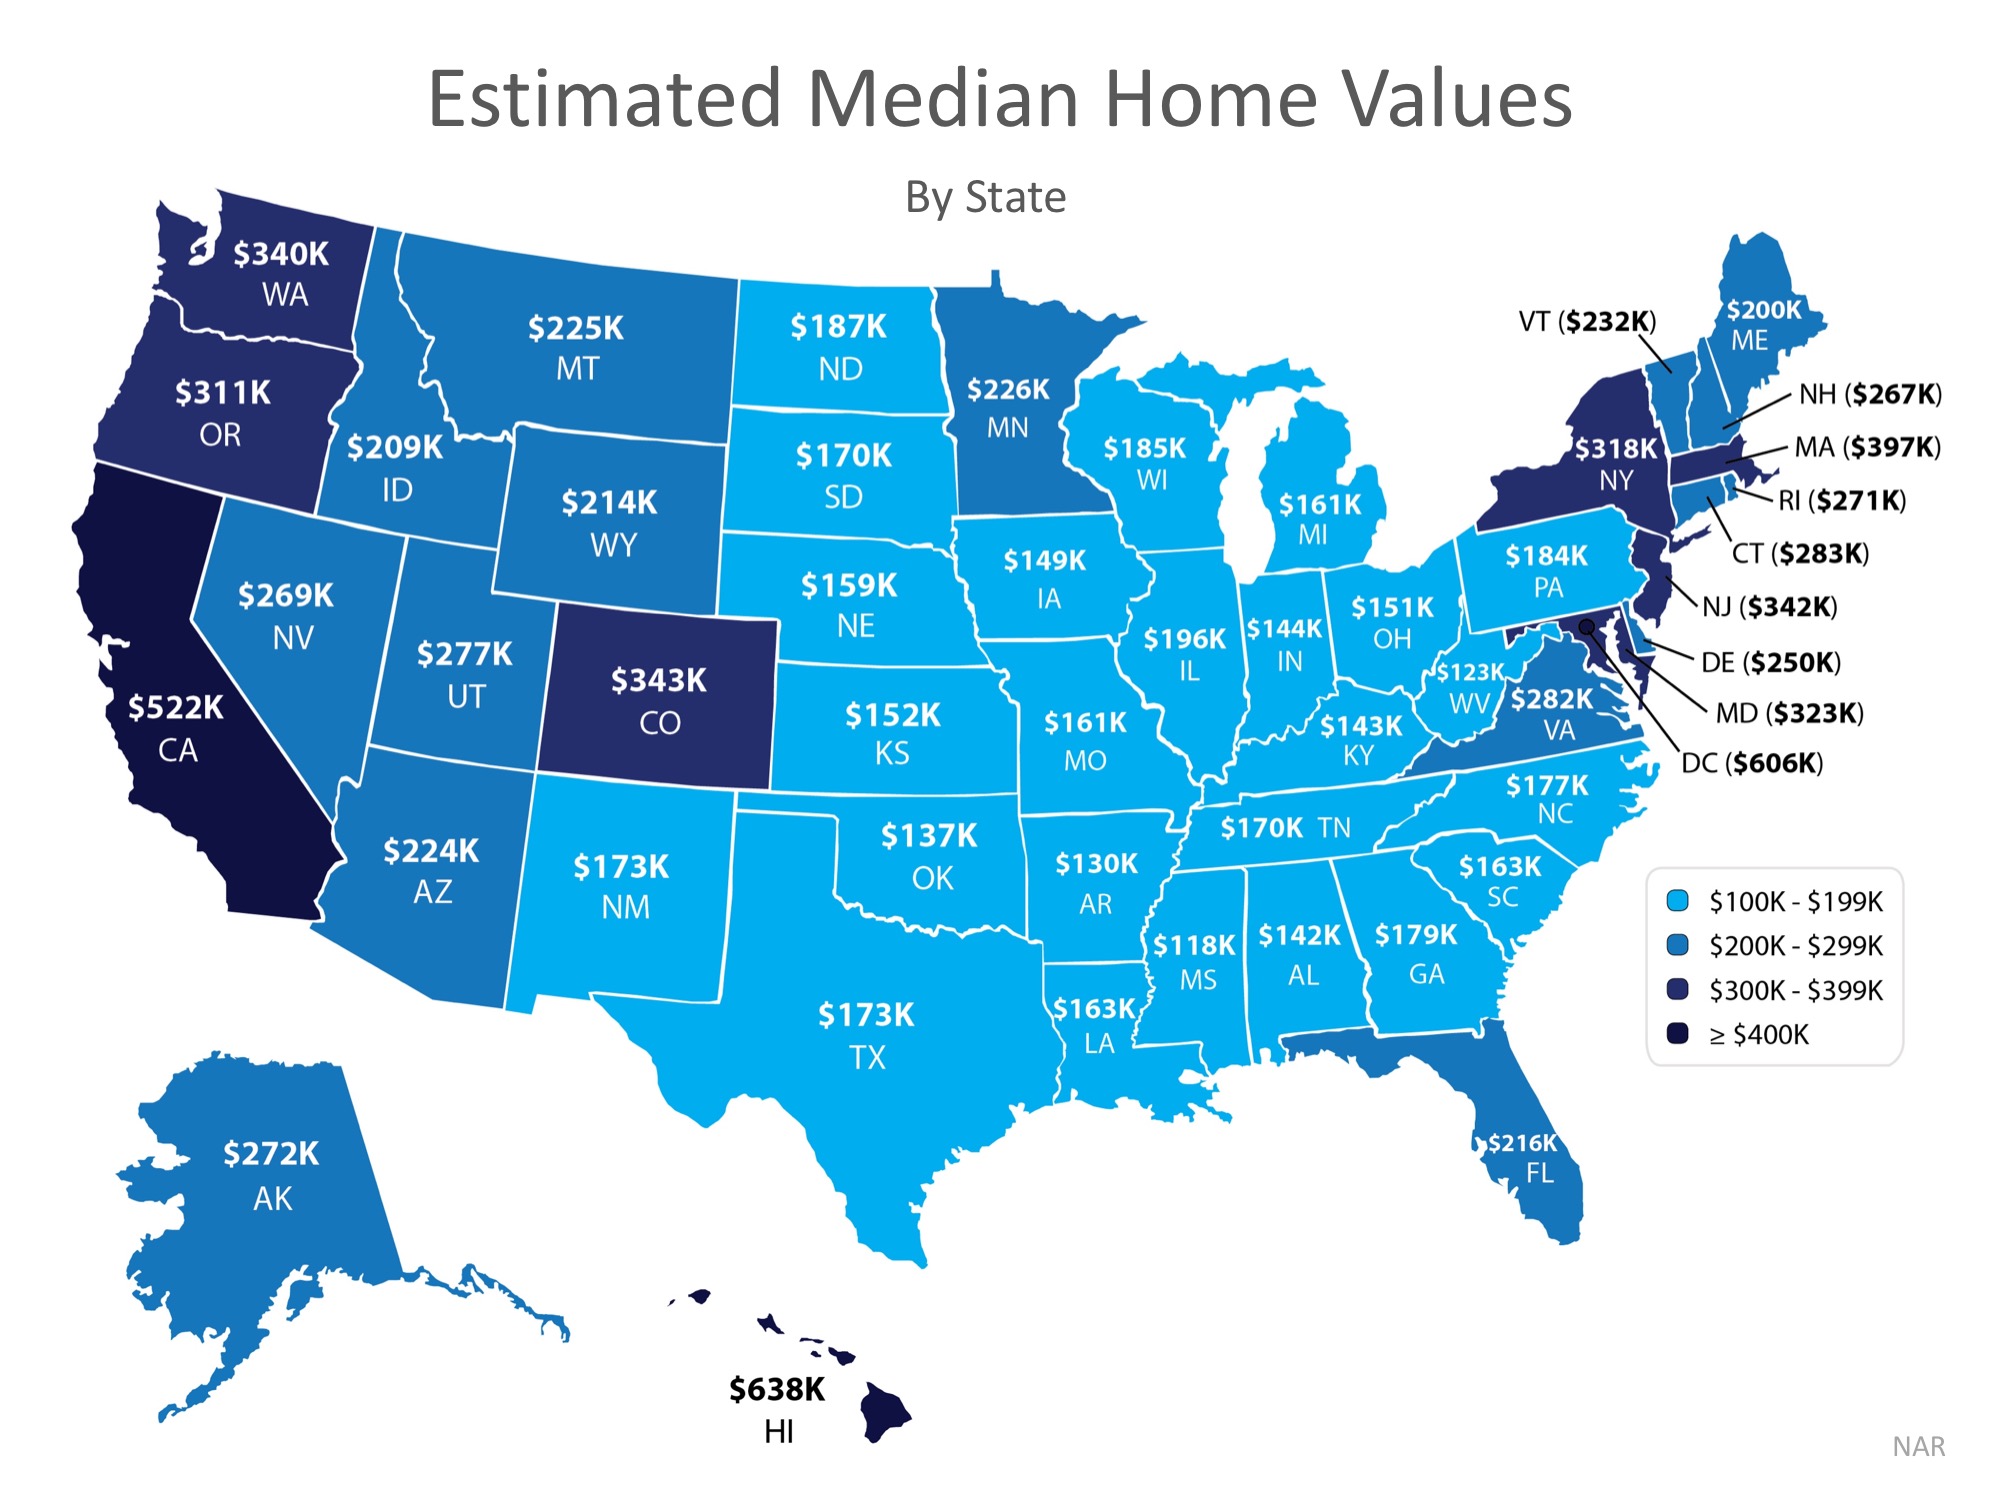
In today’s housing market where home prices are appreciating quickly, it’s important to know that not every home appreciates at the same rate. The map below demonstrates that point on a state-by-state basis using data from the National Association of Realtors.

Demand often dictates value, even for houses in the same area of the country! High demand for starter and trade-up homes have driven prices up in these categories by nearly 10% over the past year, while those in the premium markets have appreciated at closer to 6%.
Bottom Line
If you are debating whether or not to buy and/or sell a home this year, let’s get together to help you figure out exactly what’s going on in our market.
Posted in First Time Home Buyers, For Buyers, For Sellers, Move-Up Buyers, Pricing
4 Reasons to Sell This Summer [INFOGRAPHIC]
Jun
22
2018

Some Highlights:
- Buyer demand continues to outpace the supply of homes for sale which means that buyers are often competing with one another for the few listings that are available!
- Housing inventory is still under the 6-month supply needed to sustain a normal housing market.
- Perhaps the time has come for you and your family to move on and start living the life you desire.
Posted in For Sellers, Infographics, Move-Up Buyers
3 Issues Facing Today’s Real Estate Market
Jun
20
2018

Last week, the National Association of Real Estate Editors (NAREE) held their 52nd Annual Journalism Conference in Las Vegas, NV. Among the many highly anticipated sessions was one called “Top Ten Issues Affecting Real Estate™,” given by Joseph Nahas, Jr., Chair of the Counselors of Real Estate & Senior Vice President of Equus Capital Partners.
The Counselors of Real Estate (CRE) “is an international organization of high profile property professionals which include principals of prominent real estate, financial, legal, and accounting firms as well as recognized leaders of government and academia.”
Their annual “top 10” list spans any and all issues that could have an impact on the real estate market. This year, the list was broken up into “Current” and “Long-Term Issues.”
Today we’re going to focus on three of the five “Current” issues with a brief explanation of their impacts on the housing market today!
E-Commerce & Logistics
With promises of 2-day shipping no matter where you live, we are benefiting more now than ever before from the speed and ease-of-use of online retailers like Amazon. These e-retailers haven’t changed whether or not we buy certain items, but rather HOW we buy them!
Many traditional malls or big-box stores are being repurposed as warehouses or distribution centers for online retailers so that they can get their products out faster.
A Look to the Future: “Developers who are including experiences into their locations are the ones who will succeed. It’s about the experience and gaining something over just going to buy a product.”
Generational Change & Demographics
By now we’ve all heard that the millennial generation is the largest yet, just by sheer volume. The largest group of millennials turns 30 years-old in 2020. The average first-time homebuying age is between 30 and 32, depending on marital status. Real estate professionals will be inundated with more and more buyers as the years roll on. Nahas commented on this in his presentation, saying that,
“Too many developers have become dependent on making decisions based on baby boomer’s preferences.
The 75 million millennials are coming, and they will influence real estate and commerce even faster than the baby boomers in the 50s and 60s.”
Interest Rates & the Economy
The interest rate that you secure for your mortgage is a big factor in your monthly housing cost and in how much you ultimately pay for your home. According to Freddie Mac’s Primary Mortgage Market Survey, rates rose to 4.62% on a 30-year fixed rate loan last week.
The Federal Reserve also raised the federal funds rate for the second time this year. If unemployment continues to be at or near record lows, two more hikes are likely to come later this year.
Nahas added,
“Rising rates can be good and bad for the economy. Bad for borrowing money with additional costs, but good to control inflation and help grow the economy at a moderate pace.”
Bottom Line
If you are planning on buying and/or selling a home this year, let’s get together to help you navigate the conditions in your market and set you up for success.
Posted in First Time Home Buyers, For Buyers, For Sellers, Housing Market Updates, Millennials
Drop in Inventory Fuels Sales Slowdown [INFOGRAPHIC]
May
25
2018
![Drop in Inventory Fuels Sales Slowdown [INFOGRAPHIC] | Simplifying The Market](http://files.simplifyingthemarket.com/wp-content/uploads/2018/05/24164608/20180525-Share-STM.jpg)
![Drop in Inventory Fuels Sales Slowdown [INFOGRAPHIC] | Simplifying The Market](http://files.simplifyingthemarket.com/wp-content/uploads/2018/05/24164546/EHS-APR-STM-ENG.jpg)
Some Highlights:
- Existing Home Sales are now at an annual pace of 5.46 million.
- Inventory of existing homes for sale dropped to a 4-month supply, marking the 35th month in a row of declines.
- The median price of homes sold in April was $257,900. This is the 74th consecutive month of year-over-year price gains.
Posted in For Buyers, For Sellers, Infographics
Selling Your House on Your Own Could Cost You
May
24
2018

In this extremely hot real estate market, some homeowners might consider selling their homes on their own which is known as a For Sale by Owner (FSBO). They rationalize that they don’t need a real estate agent and believe that they can save the fee for the services a real estate agent offers.
However, a study by Collateral Analytics reveals that FSBOs don’t actually save anything, and in some cases may be costing themselves more, by not listing with an agent.
In the study, they analyzed home sales in a variety of markets. The data showed that:
“FSBOs tend to sell for lower prices than comparable home sales, and in many cases below the average differential represented by the prevailing commission rate.” (emphasis added)
Why would FSBOs net less money than if they had used an agent?
The study makes several suggestions:
- “There could be systematic bias on the buyer side as well. FSBO sales might attract more strategic buyers than MLS sales, particularly buyers who rationalize lower-priced bids with the logic that the seller is “saving” a traditional commission. Such buyers might specifically search for and target sellers who are not getting representational assistance from agents.” In other words, ‘bargain lookers’ might shop FSBOs more often.
- “Experienced agents are experts at ‘staging’ homes for sale” which could bring more money for the home.
- “Properties listed with a broker that is a member of the local MLS will be listed online with all other participating broker websites, marketing the home to a much larger buyer population. And those MLS properties generally offer compensation to agents who represent buyers, incentivizing them to show and sell the property and again potentially enlarging the buyer pool.” If more buyers see a home, the greater the chances are that there could be a bidding war for the property.
Conclusions from the study:
- FSBOs achieve prices significantly lower than those from similar properties sold by Realtors using the MLS.
- The data suggests the average price was near 6% lower for FSBO sales of similar properties.
Bottom Line
As Dave Ramsey, America’s trusted voice on money, explains:
“Research has shown that, between mistakes, lack of negotiating skills, pricing errors and general exposure on the market, you’ll cost yourself more than the real estate commission…You’ll come out slightly better and with a lot less hassle if you use a top-shelf agent.”
Posted in For Sellers, FSBOs, Selling Myths
Don’t Wait to Sell Your House! Buyers Are Out Now
May
21
2018

Recently released data from the National Association of Realtors (NAR) suggests that now is a great time to sell your home. The concept of ‘supply & demand’ reveals that the best price for an item is realized when the supply of that item is low and the demand for that item is high.
Let’s see how this applies to the current residential real estate market.
SUPPLY
It is no secret that the supply of homes for sale has been far below the number needed to sustain a normal market for over a year at this point. A normal market requires six months of housing inventory to meet the demand. The latest report from NAR revealed that there is currently only a 3.6-month supply of houses on the market.
Supply is currently very low!
DEMAND
A report that was just released tells us that demand is very strong. The most recent Foot Traffic Report (which sheds light on the number of buyers who are actually out looking at homes) disclosed that “foot traffic grew 10.5 points to 52.4 in March as the new season approaches.”
Demand is currently very high!
Bottom Line
Waiting to sell will only increase the competition between you and all of the other sellers putting their houses on the market later this summer. If you are debating whether or not to list your home, let’s get together to discuss the conditions in our market.
Posted in For Sellers, Housing Market Updates, Move-Up Buyers
5 Ways Tax Reform Has Impacted the 2018 Housing Market
May
10
2018

Starting late last year, some predicted that the 2018 tax changes would cripple the housing market. Headlines warned of the potential for double-digit price depreciation and suggested that buyer demand could drop like a rock. There was even sentiment that homeownership could lose its coveted status as a major component of the American Dream.
Now that the first quarter numbers are in, we can begin to decipher the actual that impact tax reform has had on the real estate market.
1. Has tax reform killed off home buyer demand? The answer is “NO.”
According to the Showing Time Index which “tracks the average number of buyer showings on active residential properties on a monthly basis” and is a “highly reliable leading indicator of current and future demand trends,” buyer demand has increased each month over the last three months and is HIGHER than it was for the same months last year. Buyer demand is not down. It is up.
2. Have the tax changes affected America’s belief in real estate as a long-term investment? The answer is “NO.”
Two weeks ago, Gallup released its annual survey which asks Americans which asset they believed to be the best long-term investment. The survey revealed:
“More Americans name real estate over several other vehicles for growing wealth as the best long-term investment for the fifth year in a row. Just over a third cite real estate for this, while roughly a quarter name stocks or mutual funds.”
The survey also showed that the percentage of Americans who believe real estate is the best long-term investment was unchanged from a year ago.
3. Has the homeownership rate been negatively impacted by the tax changes? The answer is “NO.”
Not only did the homeownership rate not crash, it increased when compared to the first quarter of last year according to data released by the Census Bureau.
In her latest “Z Report,” Ivy Zelman explains that tax reform didn’t hurt the homeownership rate, but instead, enhanced it:
“We have been of the opinion that homeownership is most highly correlated with income and the net effect of tax reform would be a positive, rather than negative catalyst for the homeownership rate. While still in the early innings of tax changes, this has proven to be the case.”
4. Has the upper-end market been crushed by new State and Local Taxes (SALT) limitations? The answer is “NO.”
In the National Association of Realtors latest Existing Home Sales Report it was revealed that:
- Sales between $500,000 and $750,000 were up 4.5% year-over-year
- Sales between $750,000 and $1M were up 15.1% year-over-year
- Sales over $1M were up 17.3% year-over-year
5. Will the reforms in the tax code cause home prices to tumble over the next twelve months? The answer is “NO.”
According to CoreLogic’s latest Home Price Insights Report, home prices will appreciate in each of the 50 states over the next twelve months. Appreciation is projected to be anywhere from 1.9% to 10.3% with the national average being 4.7%.
Bottom Line
The doomsday scenarios that some predicted based on tax reform fears seem to have already blown over based on the early housing industry numbers being reported.
Posted in First Time Home Buyers, For Buyers, For Sellers, Housing Market Updates, Move-Up Buyers
This Just In: Data Says May is the Best Month to Sell Your Home
May
02
2018

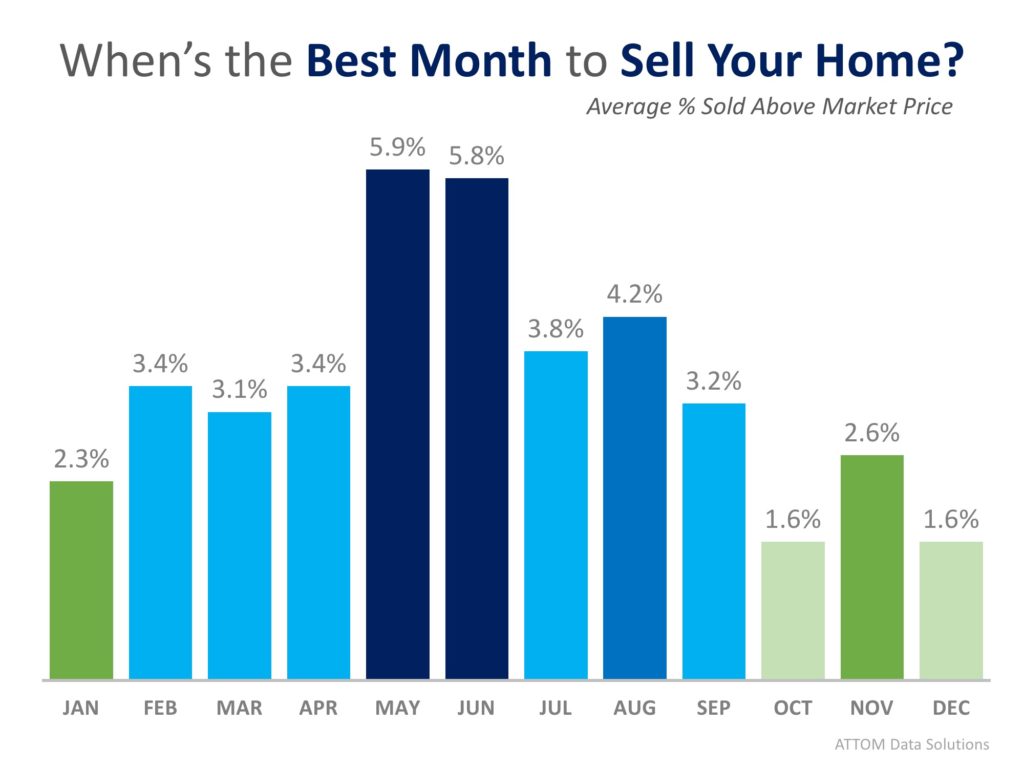
According to a newly released study by ATTOM Data Solutions, selling your home in the month of May will net you an average of 5.9% above estimated market value for your home.
For the study, ATTOM performed an “analysis of 14.7 million home sales from 2011 to 2017” and found the average seller premium achieved for each month of the year. Below is a breakdown by month:
ATTOM even went a step further and broke their results down by day.
Top 5 Days to Sell:
- June 28th – 9.1% above market
- February 15th – 9.0% above market
- May 31st – 8.3% above market
- May 29th – 8.2% above market
- June 21st – 8.1% above market
It should come as no surprise that May and June dominate as the top months to sell and that 4 of the top 5 days to sell fall in those two months. The second quarter of the year (April, May, June) is referred to as the Spring Buyers Season, when competition is fierce to find a dream home, which often leads to bidding wars.
One caveat to mention though, is that when broken down by metro, ATTOM noticed that while warmer climates share in the overall trend, it turns out that they have different top months for sales. The best month to get the highest price in Miami, FL, for instance, was January, and Phoenix, AZ came in with November leading the charge.
If you’re thinking of selling your home this year, the time to list is NOW! According to the National Association of Realtors, homes sold in an average of just 30 days last month! If you list now, you’ll have a really good chance to sell in May or June, setting yourself up for getting the best price!
Bottom Line
Let’s get together to discuss the market conditions in our area and get you the most exposure to the buyers who are ready and willing to buy!
Posted in For Sellers, Move-Up Buyers, Pricing
How Much Has Your Home Increased in Value Over the Last Year?
May
01
2018

Home values have risen dramatically over the last twelve months. In CoreLogic’s most recent Home Price Index Report, they revealed that national home prices have increased by 6.7% year-over-year.
CoreLogic broke down appreciation even further into four price ranges, giving us a more detailed view than if we had simply looked at the year-over-year increases in national median home price.
The chart below shows the four price ranges from the report, as well as each one’s year-over-year growth from February 2017 to February 2018 (the latest data available).
It is important to pay attention to how prices are changing in your local market. The location of your home is not the only factor that determines how much your home has appreciated over the course of the last year.
Lower-priced homes have appreciated at greater rates than homes at the upper ends of the spectrum due to demand from first-time home buyers and baby boomers looking to downsize.
Bottom Line
If you are planning to list your home for sale in today’s market, let’s get together to go over exactly what’s going on in your area and your price range.
Posted in First Time Home Buyers, For Buyers, For Sellers, Housing Market Updates, Move-Up Buyers
Buyer Demand Still Outpacing the Supply of Homes for Sale
Mar
27
2018

The price of any item is determined by the supply of that item, as well as market demand. The National Association of REALTORS (NAR) surveys “over 50,000 real estate practitioners about their expectations for home sales, prices and market conditions” for their monthly REALTORS Confidence Index.
Their latest edition sheds some light on the relationship between Seller Traffic (supply) and Buyer Traffic (demand).
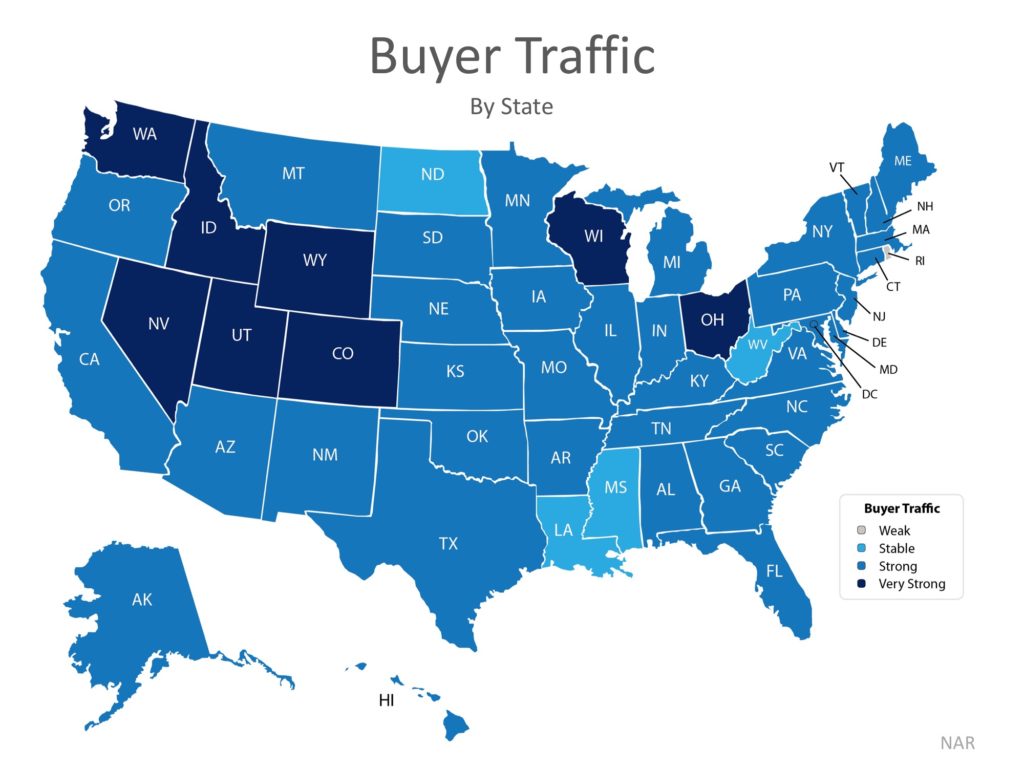
Buyer Demand
The map below was created after asking the question: “How would you rate buyer traffic in your area?”
The darker the blue, the stronger the demand for homes in that area. Only four states had a ‘stable’ demand level.
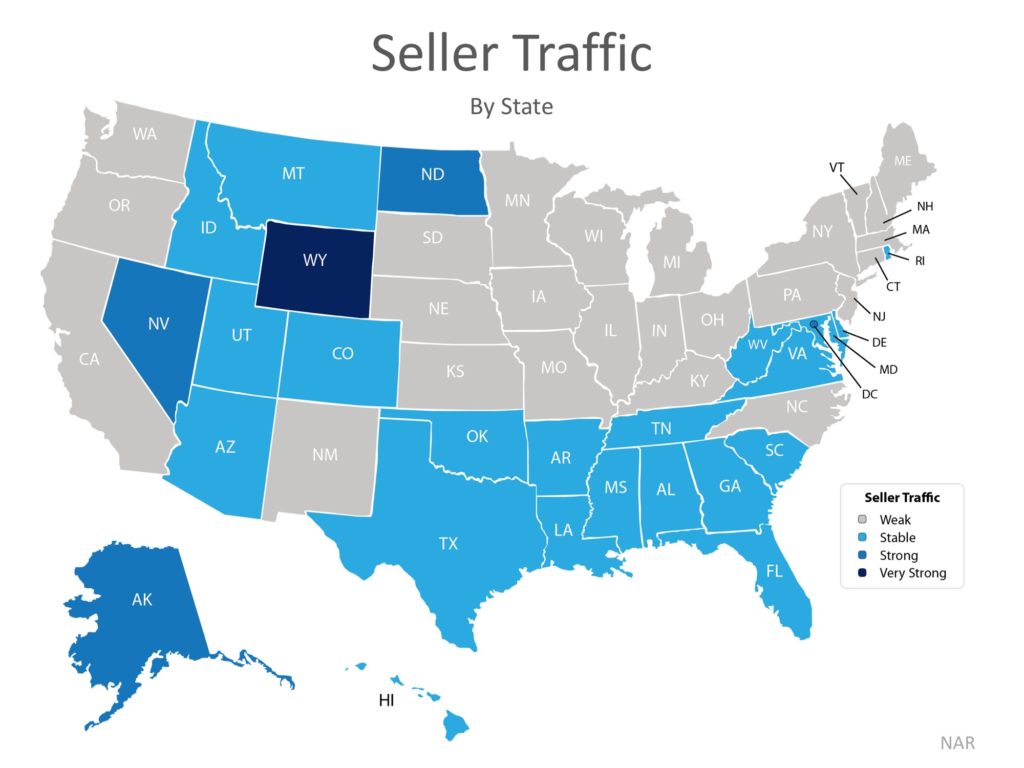
Seller Supply
The index also asked: “How would you rate seller traffic in your area?”
As you can see from the map below, 25 states reported ‘weak’ seller traffic, 21 states reported ‘stable’ seller traffic, 3 states and Washington D.C. reported ‘strong’ seller traffic, and only 1 state reported ‘very strong’ seller traffic. This means there are far fewer homes on the market than what is needed to satisfy the buyers who are out looking for their dream homes.
Bottom Line
Looking at the maps above, it is not hard to see why prices are appreciating in many areas of the country. Until the supply of homes for sale starts to meet buyer demand, prices will continue to increase. If you are debating listing your home for sale, let’s get together to help you capitalize on the demand in the market now!
Posted in For Buyers, For Sellers


