Category: For Sellers
January 31st, 2018 by Lum Hugh

When it comes to talking about millennials, there are many stereotypes out there that have influenced the way the public feels about the generation. Whether it’s the assumption that millennials are irresponsible with money and would rather buy avocado toast than save for a down payment, or that millennials jump from job to job, the majority of these stereotypes paint the generation in a negative light.
A new study by Bank of America entitled Better Money Habits Millennial Report recently came to the defense of the generation when it reported that:
“Millennials deserve more credit – both from themselves and from others – for their mindfulness when it comes to money and their lives.”
Here are some key takeaways from the study proving that millennials deserve more credit for what they are already doing:
- 63% are saving – (47% have $15,000 or more in savings)
- 54% are budgeting – (73% who have a budget stick to it every month)
- 57% have a savings goal – (67% who have a goal stick to it every month)
- 46% have asked for a raise in the past 2 years – (80% who asked for a raise got one)
- 59% feel financially secure – (16% have $100,000 or more in savings)
Many have wondered if millennials even want to own their own homes or if they would choose to rent instead. Well, not only do they want to own their own homes, but many already do and are looking to trade up! A recent study by realtor.com shows that 49% of Americans who plan to sell their home in the next 12 months are millennials!
Danielle Hale, realtor.com’s Chief Economist, gave some insight into why millennials are looking to sell,
“The housing shortage forced many first-time homebuyers to consider smaller homes and condos as a way to literally get their foot in the door. Our survey data reveals that we may see more of these homes hitting the market in the next year.”
Bottom Line
Not every millennial fits into the stereotypes that are so prominent in our society. Those who have risen above the stereotype are ready and willing to buy a home of their own, and many others already have!
Posted in First Time Home Buyers, For Buyers, For Sellers, Millennials, Move-Up Buyers
January 29th, 2018 by Lum Hugh

Every winter, families across the country decide if this will be the year that they sell their current houses and move into their dream homes.
Mortgage rates hovered around 4% for all of 2017 which forced many buyers off the fence and into the market, resulting in incredibly strong demand RIGHT NOW!
At the same time, however, inventory levels of homes for sale have dropped dramatically as compared to this time last year.
Trulia reported that “in Q4 2017, U.S. home inventory decreased by 10.5%. That is the biggest drop we’ve seen since Q2 2013.”
Here is a chart showing the decrease in inventory levels by category:

The largest drop in inventory was in the starter home category which saw a 19% dip in listings.
Bottom Line
Demand for your home is very strong right now while your competition (other homes for sale) is at a historically low level. If you are thinking of selling in 2018, now may be the perfect time.
Posted in For Sellers, Housing Market Updates, Move-Up Buyers
January 25th, 2018 by Lum Hugh

Definitely an aggressive headline. However, as the final data on the 2017 housing market rolls in, we can definitely say one thing: If you are considering selling, IT IS TIME TO LIST YOUR HOME!
How did we finish 2017?
- New-home sales were at their highest level in a decade.
- Sales of previously owned homes were at their highest level in more than a decade.
- Starts of single-family homes were their strongest in a decade and applications to build such properties advanced to the fastest pace since August 2007.
And Bloomberg Business just reported:
“America’s housing market is gearing up for a robust year ahead. Builders are more optimistic, demand is strong and lean inventory is keeping prices elevated.”
And the National Association of Realtors revealed that buyer traffic is stronger this winter than it was during the spring buying season last year.
The only challenge to the market is a severe lack of inventory. A balanced market would have a full six-month supply of homes for sale. Currently, there is less than a four-month supply of inventory. This represents a decrease in supply of 9.7% from the same time last year.
Bottom Line
With demand increasing and supply dropping, this may be the perfect time to get the best price for your home. Let’s get together to see whether that is the case in your neighborhood.
Posted in For Sellers, Housing Market Updates, Move-Up Buyers
January 24th, 2018 by Lum Hugh

In today’s housing market, where supply is very low and demand is very high, home values are increasing rapidly. Many experts are projecting that home values could appreciate by another 4% or more over the next twelve months. One major challenge in such a market is the bank appraisal.
When prices are surging, it is difficult for appraisers to find adequate, comparable sales (similar houses in the neighborhood that recently closed) to defend the selling price when performing the appraisal for the bank.
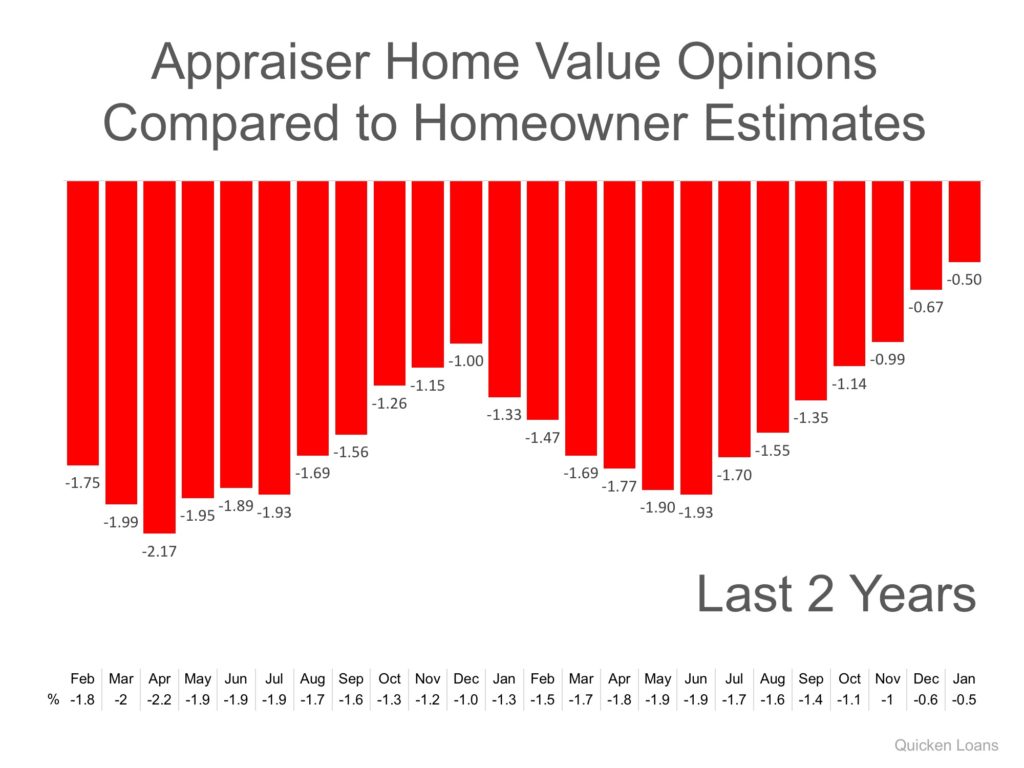
Every month in their Home Price Perception Index (HPPI), Quicken Loans measures the disparity between what a homeowner who is seeking to refinance their home believes their house is worth and what an appraiser’s evaluation of that same home is.
In the latest release, the disparity was the narrowest it has been in over two years, as the gap between appraisers and homeowners was only -0.5%. This is important for homeowners to note as even a .5% difference in appraisal can mean thousands of dollars that a buyer or seller would have to come up with at closing (depending on the price of the home)
The chart below illustrates the changes in home price estimates over the last two years.
Bill Banfield, Executive VP of Capital Markets at Quicken Loans urges homeowners to find out how their local markets have been impacted by supply and demand:
“Appraisers and real estate professionals evaluate their local housing markets daily. Homeowners, on the other hand, may only think about their housing market when they see ‘for sale’ signs hit front yards in the spring or when they think about accessing their equity.”
“With several years of growth, owners may have more equity than they realize. Many consumers use the tax season at the beginning of the year to reevaluate their entire financial life. It also provides a good opportunity for them to consider how best to take advantage of their equity while mortgage interest rates and borrowing costs are still near record lows.”
Bottom Line
Every house on the market must be sold twice; once to a prospective buyer and then to the bank (through the bank’s appraisal). With escalating prices, the second sale might be even more difficult than the first. If you are planning on entering the housing market this year, let’s get together to discuss this and any other obstacles that may arise.
Posted in For Sellers, Move-Up Buyers, Pricing
January 19th, 2018 by Lum Hugh
![Where Did Americans Move in 2017? [INFOGRAPHIC] | Simplifying The Market](http://files.simplifyingthemarket.com/wp-content/uploads/2018/01/09171302/20180119-STM-Share.jpg)
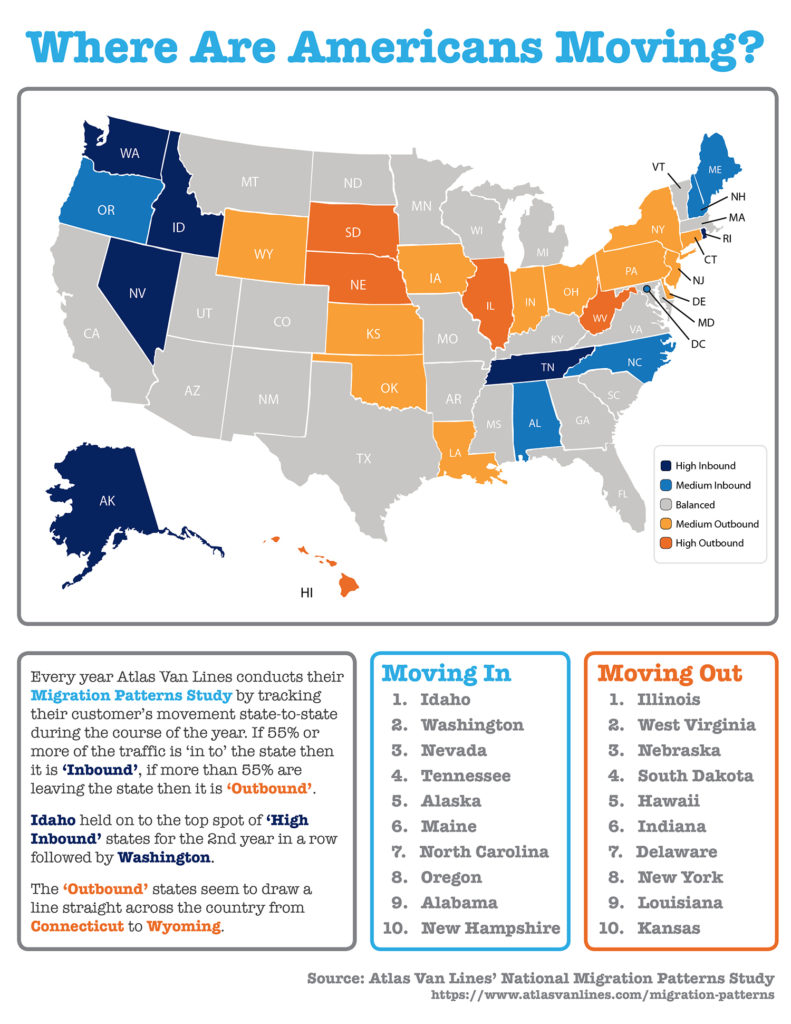
Some Highlights:
- Atlas Van Lines recently released the results of their annual Migration Patterns Survey in which they tracked their customer’s movement from state-to-state over the course of 2017.
- Idaho held on to the top spot of ‘high inbound’ states for the 2nd year in a row followed by Washington.
- The ‘outbound’ states seem to draw a line straight across the country from Connecticut to Wyoming.
Posted in First Time Home Buyers, For Buyers, For Sellers, Housing Market Updates, Infographics, Move-Up Buyers
January 18th, 2018 by Lum Hugh

Every month, CoreLogic releases its Home Price Insights Report. In that report, they forecast where they believe residential real estate prices will be in twelve months.
Below is a map, broken down by state, reflecting how home values are forecasted to change by the end of 2018 using data from the most recent report.
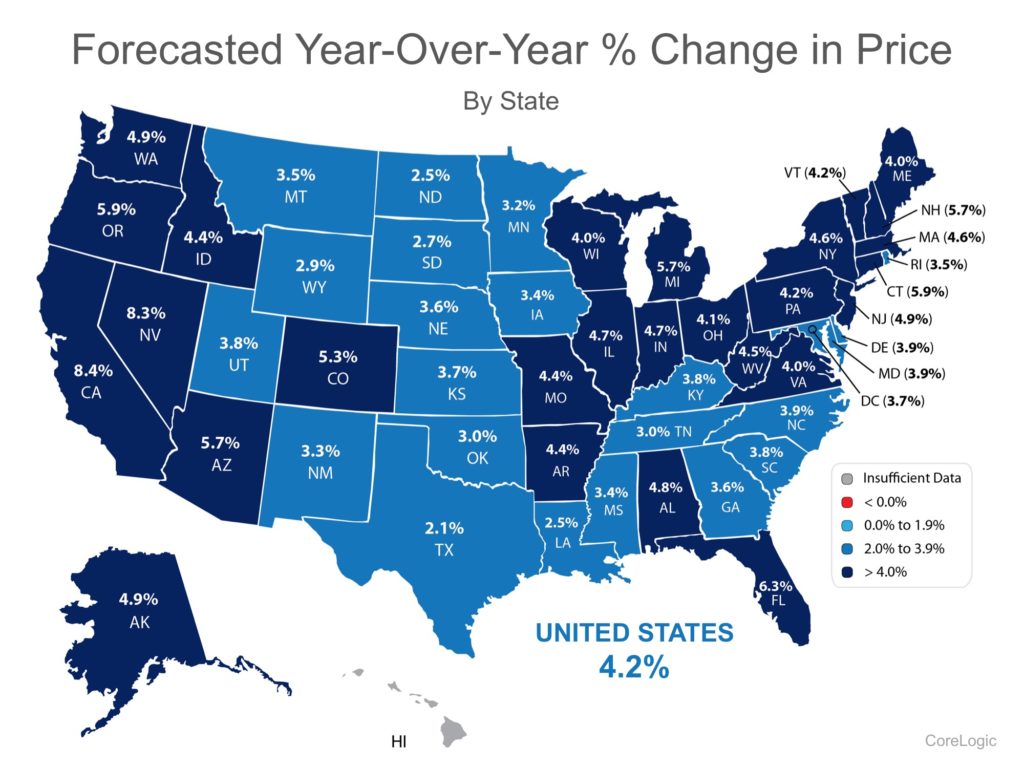
As we can see, CoreLogic projects an increase in home values in 49 of 50 states, and Washington, DC (there was insufficient data for HI). Nationwide, they see home prices increasing by 4.2%.
How might the new tax code impact these numbers?
Recently, the National Association of Realtors (NAR) conducted their own analysis to determine the impact the new tax code may have on home values. NAR’s analysis:
“…estimated how home prices will change in the upcoming year for each state, considering the impact of the new tax law and the momentum of jobs and housing inventory.”
Here is a map based on NAR’s analysis:

Bottom Line
According to NAR, the new tax code will have an impact on home values across the country. However, the effect will be much less significant than what some originally thought.
Posted in First Time Home Buyers, For Buyers, For Sellers, Housing Market Updates, Move-Up Buyers, Pricing
January 15th, 2018 by Lum Hugh

It is common knowledge that a great number of homes sell during the spring-buying season. For that reason, many homeowners hold off on putting their homes on the market until then. The question is whether or not that will be a good strategy this year.
The other listings that do come out in the spring will represent increased competition to any seller. Do a greater number of homes actually come to the market in the spring as compared to the rest of the year? The National Association of Realtors (NAR) recently revealed the months in which most people listed their homes for sale in 2017. Here is a graphic showing the results:

The three months in the second quarter of the year (represented in red) are consistently the most popular months for sellers to list their homes on the market. Last year, the number of homes available for sale in January was 1,680,000.
That number spiked to 1,970,000 by May!
What does this mean to you?
With the national job situation improving, and mortgage interest rates projected to rise later in the year, buyers are not waiting until the spring; they are out looking for homes right now. If you are looking to sell this year, waiting until the spring to list your home means you will have the greatest competition amongst buyers.
Bottom Line
It may make sense to beat the rush of housing inventory that will enter the market in the spring and list your home today.
Posted in For Sellers, Move-Up Buyers

January 9th, 2018 by LHugh
The housing crisis is finally in the rear-view mirror as the real estate market moves down the road to a complete recovery. Home values are up, home sales are up, and distressed sales (foreclosures and short sales) have fallen to their lowest points in years. It seems that the market will continue to strengthen in 2018.
However, there is one thing that may cause the industry to tap the brakes: a lack of housing inventory. While buyer demand looks like it will remain strong throughout the winter, supply is not keeping up.
Here are the thoughts of a few industry experts on the subject:
National Association of Realtors
“Total housing inventory at the end of November dropped 7.2 percent to 1.67 million existing homes available for sale, and is now 9.7 percent lower than a year ago (1.85 million) and has fallen year-over-year for 30 consecutive months. Unsold inventory is at a 3.4-month supply at the current sales pace, which is down from 4.0 months a year ago.”
Joseph Kirchner, Senior Economist for Realtor.com
“The increases in single-family permits and starts show that builders are planning and starting new construction projects, that’s a good thing because it will help to relieve the shortage of homes on the market.”
Sam Khater, Deputy Chief Economist at CoreLogic
“Inventory is tighter than it appears. It’s much lower for entry-level buyers.”
Bottom Line
If you are thinking of selling, now may be the time. Demand for your house will be strong at a time when there is very little competition. That could lead to a quick sale for a really good price.
Posted in For Buyers, For Sellers, Housing Market Updates, Move-Up Buyers

January 8th, 2018 by LHugh
CoreLogic’s latest Equity Report revealed that “over the past 12 months, 712,000 borrowers moved into positive equity.” This is great news, as the share of homeowners with negative equity (those who owe more than their home is worth), has dropped more than 20% since the peak in Q4 of 2009 (26%) to 4.9% today.
The report also revealed:
- The average homeowner gained approximately $14,900 in equity during the past year.
- Compared to Q3 2016, negative equity decreased 22% from 3.2 million homes, or 6.3% of all mortgaged properties.
- U.S. homeowners with mortgages (roughly 63% of all homeowners) have seen their equity increase by a total of $870.6 billion since Q3 2016, an increase of 11.8%, year-over-year.
The map below shows the percentage of homes by state with a mortgage and positive equity. (The states in gray have insufficient data to report.)
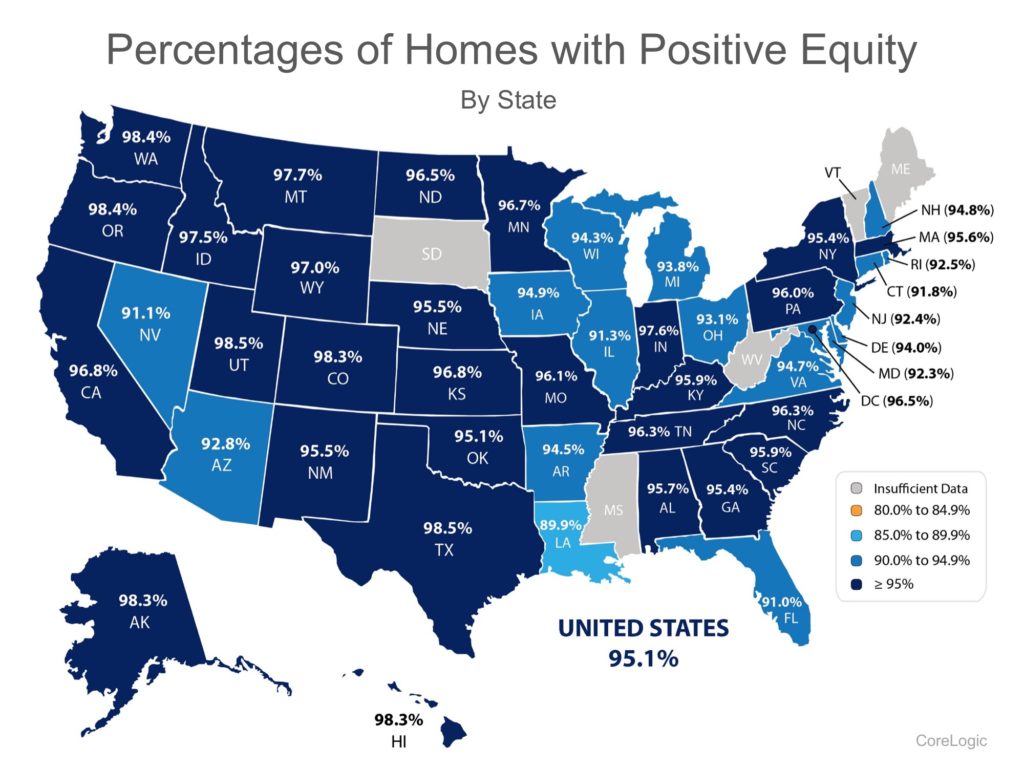
Significant Equity Is on The Rise
Frank Nothaft, Chief Economist at CoreLogic, believes this is great news for the “housing market.” He went on to say:
“Homeowner equity increased by almost $871 billion over the last 12 months, the largest increase in more than three years. This increase is primarily a reflection of rising home prices, which drives up home values, leading to an increase in home equity positions and supporting consumer spending.”
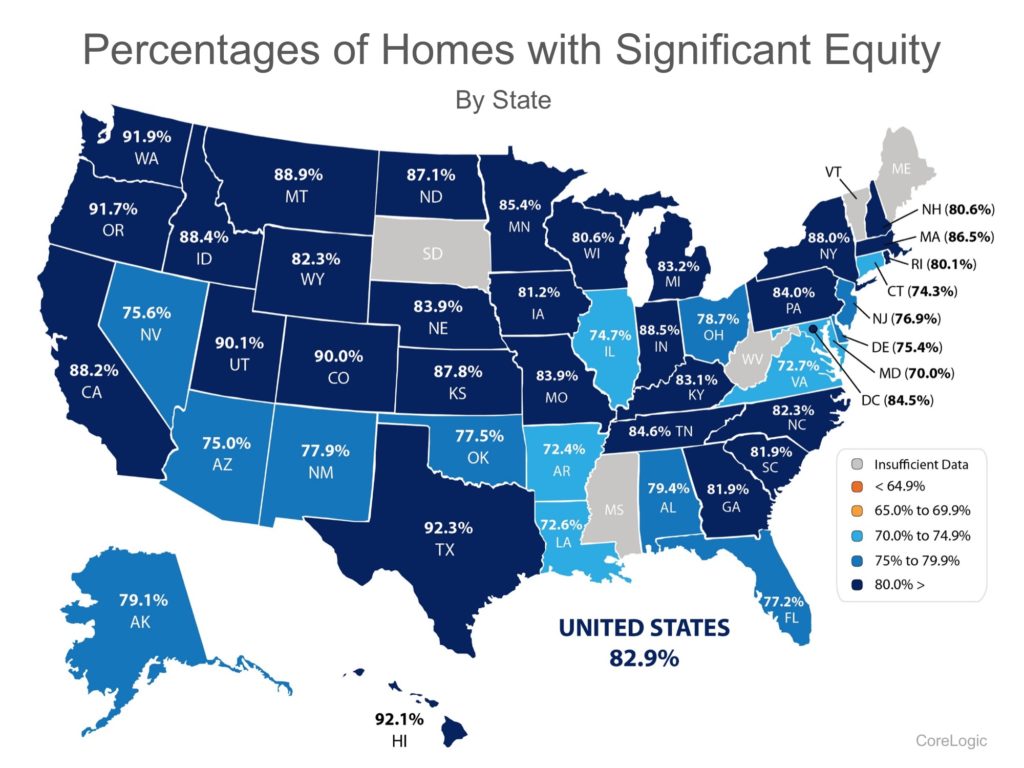
Of the 95.1% of homeowners with positive equity in the U.S., 82.9% have significant equity (defined as more than 20%). This means that more than three out of four homeowners with a mortgage could use the equity in their current home to purchase a new home now.
The map below shows the percentage of homes by state with a mortgage and significant equity.
Bottom Line
If you are one of the many homeowners who are unsure of how much equity you have in your home and are curious about your ability to move, let’s meet up to evaluate your situation.
Posted in For Sellers, Housing Market Updates
January 5th, 2018 by LHugh

Some Highlights:
- Buyer demand continues to outpace the supply of homes for sale which means that buyers are often competing with one another for the few listings that are available!
- Housing inventory is still under the 6-month supply needed to sustain a normal housing market.
- Perhaps the time has come for you and your family to move on and start living the life you desire.
Posted in For Buyers, For Sellers, Infographics, Move-Up Buyers


![Where Did Americans Move in 2017? [INFOGRAPHIC] | Simplifying The Market](http://files.simplifyingthemarket.com/wp-content/uploads/2018/01/09171302/20180119-STM-Share.jpg)


