Category: Infographics
3 Tips for Making Your Dream Home a Reality [INFOGRAPHIC]
Dec
08
2017
![3 Tips for Making Your Dream Home a Reality [INFOGRAPHIC] | Simplifying The Market](http://files.simplifyingthemarket.com/wp-content/uploads/2017/12/06164805/20171208-Share-STM.jpg)
Some Highlights:
- Realtor.com shared their “5 Habits to Start Now If You Hope to Buy a Home.”
- Setting up an automatic savings plan that saves a small amount of every check is one of the best ways to save without thinking a lot about it.
- Living within a budget will not only help you save money for down payments but will help you pay down other debts that might be holding you back.
Posted in Down Payments, First Time Home Buyers, For Buyers, Infographics
Median Days on the Market Drops to 34! [INFOGRAPHIC]
Dec
01
2017
![Median Days on the Market Drops to 34! [INFOGRAPHIC] | Simplifying The Market](http://d39ah2zlibpm3g.cloudfront.net/wp-content/uploads/2017/11/30154450/20171201-Share-STM.jpg)
Some Highlights:
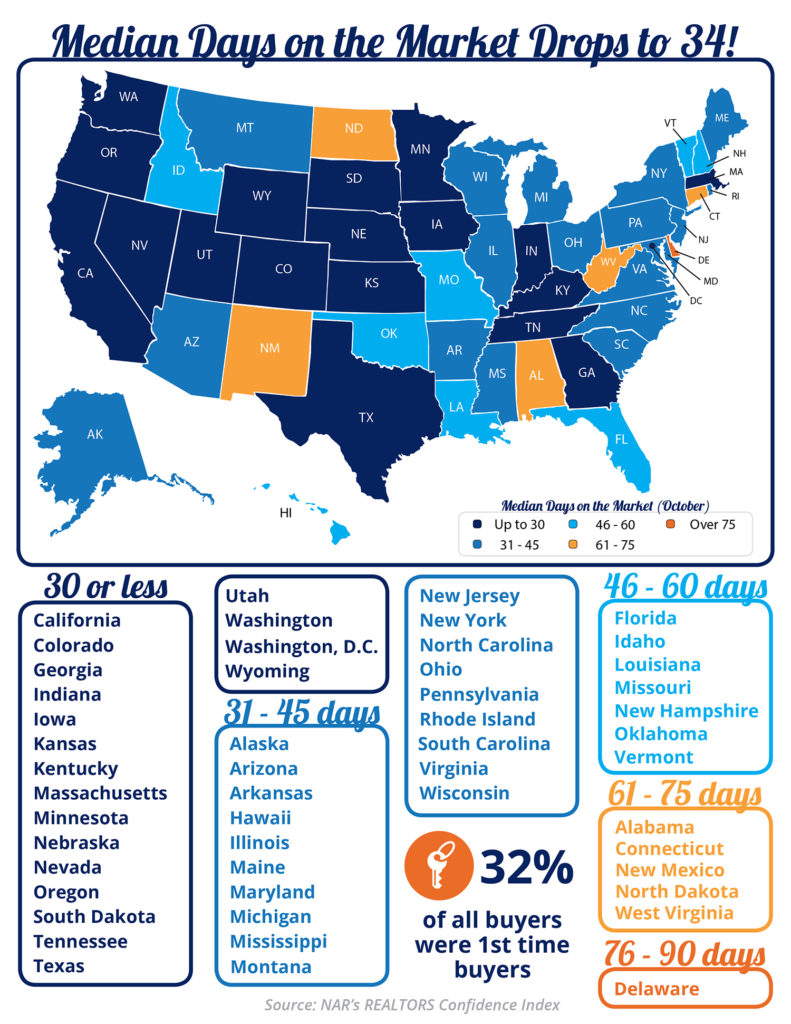
- The National Association of REALTORS® surveyed their members for their Confidence Index.
- The REALTORS® Confidence Index is a key indicator of housing market strength based on a monthly survey sent to over 50,000 real estate practitioners. Practitioners are asked about their expectations for home sales, prices and market conditions.
- Homes sold in less than 60 days in 44 out of 50 states, and Washington D.C.
- Homes typically went under contract in 34 days in October!
Posted in For Buyers, For Sellers, Infographics
Existing Home Sales Slowed by a Lack of Listings [INFOGRAPHIC]
Nov
24
2017

Some Highlights:
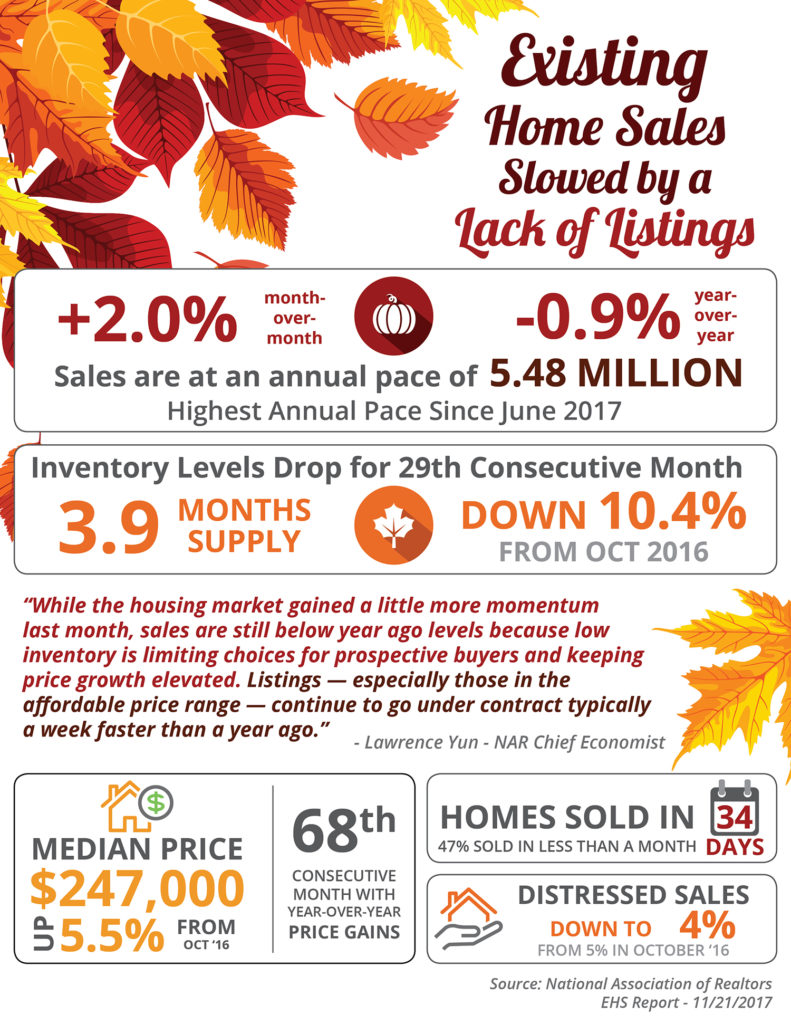
- The inventory of existing homes for sale has dropped year-over-year for the last 29 consecutive months and is now at a 3.9-month supply.
- Existing home sales are currently at an annual pace of 5.48 million, the highest pace since June of this year, but down 0.9% from October 2016.
- NAR’s Chief Economist, Lawrence Yun, had this to say: “While the housing market gained a little more momentum last month, sales are still below year ago levels because low inventory is limiting choices for prospective buyers and keeping price growth elevated.”
Posted in For Buyers, For Sellers, Housing Market Updates, Infographics, Move-Up Buyers
Top 4 Home Renovations for Maximum ROI [INFOGRAPHIC]
Nov
17
2017
![Top 4 Home Renovations for Maximum ROI [INFOGRAPHIC] | Simplifying The Market](http://d39ah2zlibpm3g.cloudfront.net/wp-content/uploads/2017/11/14114524/20171117-Share-STM.jpg)
Some Highlights:
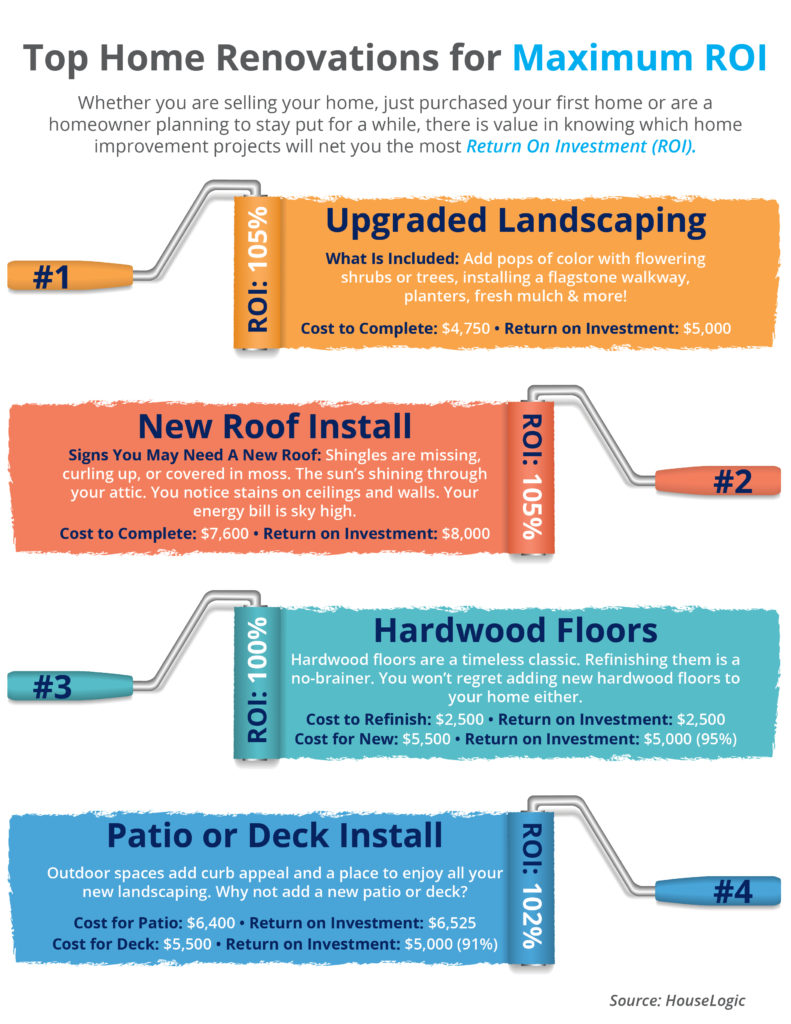
- Whether you are selling your home, just purchased your first home, or are a homeowner planning to stay put for a while, there is value in knowing which home improvement projects will net you the most “Return On Investment” (ROI).
- While big projects like adding a bathroom or a complete remodel of a kitchen are popular ways to increase a home’s value, something as simple as updating landscaping and curb appeal can have a quick impact on a home’s value.
Posted in First Time Home Buyers, For Buyers, For Sellers, Infographics, Move-Up Buyers
Veterans Affairs Loans by the Numbers [INFOGRAPHIC]
Nov
10
2017

Some Highlights:
- Since the creation of the VA Home Loans Program, 22 million veterans have been able to achieve the American Dream of homeownership.
- So far in 2017, $188 billion has been loaned to veterans and their families through the program.
- VA Purchase Loans are on the rise in 46 out of 50 states and Washington, DC.
Posted in First Time Home Buyers, For Buyers, Infographics, Move-Up Buyers
The Difference an Hour Makes in Real Estate [INFOGRAPHIC]
Nov
03
2017

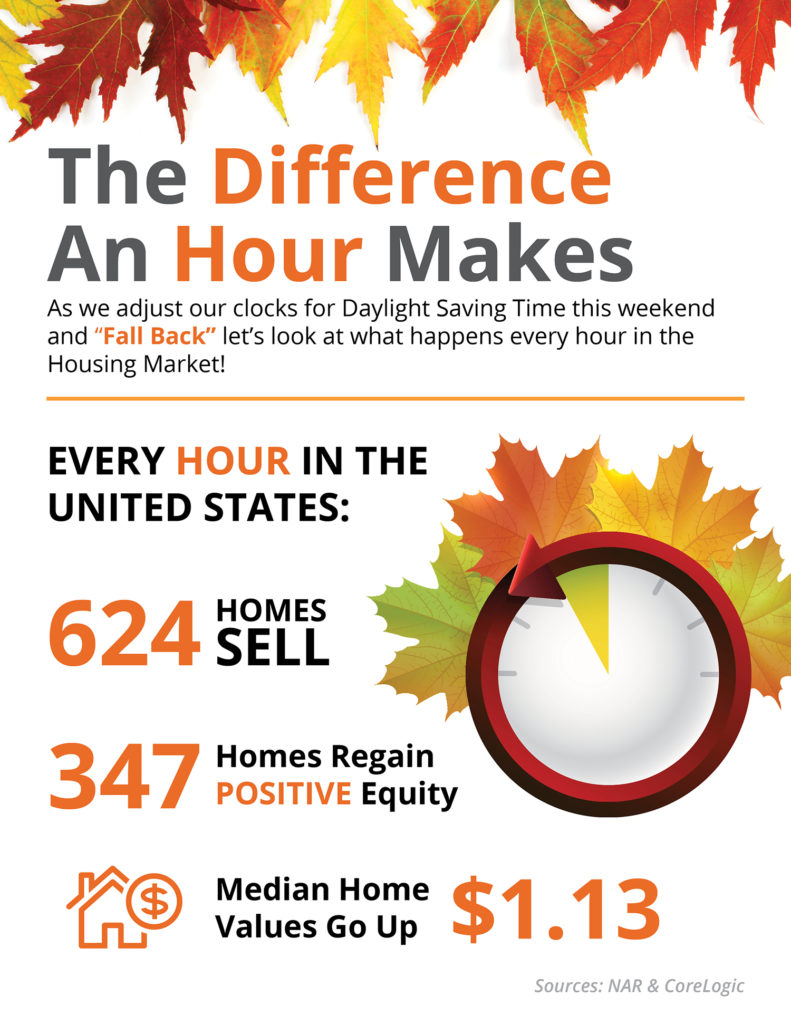
Every Hour in the US Housing Market:
- 624 Homes Sell
- 347 Homes Regain Positive Equity
- Median Home Values Go Up $1.13
Posted in For Buyers, For Sellers, Infographics
Buying a Home Can Be Scary… Unless You Know the Facts [INFOGRAPHIC]
Oct
27
2017

Some Highlights:
Many potential homebuyers believe that they need a 20% down payment and a 780 FICO® score to qualify to buy a home, which stops many of them from even trying! Here are some facts:
- 40% of millennials who purchased homes this year have put down less than 10%.
- 76.4% of loan applications were approved last month.
- The average credit score of approved loans was 724 in September.
Posted in Buying Myths, Down Payments, First Time Home Buyers, For Buyers, Infographics, Millennials
The Cost of Renting vs. Buying a Home [INFOGRAPHIC]
Oct
20
2017
![The Cost of Renting vs. Buying a Home [INFOGRAPHIC] | Simplifying The Market](http://d39ah2zlibpm3g.cloudfront.net/wp-content/uploads/2017/10/19155904/20171020-Share-STM.jpg)
Some Highlights:
- Historically, the choice between renting or buying a home has been a tough decision.
- Looking at the percentage of income needed to rent a median-priced home today (29.2%) vs. the percentage needed to buy a median-priced home (15.8%), the choice becomes obvious.
- Every market is different. Before you renew your lease again, find out if you can put your housing costs to work by buying this year!
Posted in Buying Myths, For Buyers, Infographics, Rent vs. Buy
4 Reasons to Sell This Fall [INFOGRAPHIC]
Oct
13
2017

Some Highlights:
- Buyer demand continues to outpace the supply of homes for sale! Buyers are often competing with one another for the listings that are available!
- Housing inventory is still under the 6-month supply that is needed for a normal housing market.
- Perhaps the time has come for you and your family to move on and start living the life you desire.
Posted in First Time Home Buyers, For Buyers, For Sellers, Infographics, Move-Up Buyers
The Mortgage Process: What You Need to Know [INFOGRAPHIC]
Oct
06
2017
![The Mortgage Process: What You Need to Know [INFOGRAPHIC] | Simplifying The Market](http://d39ah2zlibpm3g.cloudfront.net/wp-content/uploads/2017/10/05103803/20170428-Share-STM.jpg)
Some Highlights:
- Many buyers are purchasing a home with a down payment as little as 3%.
- You may already qualify for a loan, even if you don’t have perfect credit.
- Take advantage of the knowledge of your local professionals who are there to help you determine how much you can afford.
Posted in Buying Myths, First Time Home Buyers, For Buyers, Infographics, Move-Up Buyers

