Category: Infographics
Should I Buy a Home Now? Or Wait Until Next Year? [INFOGRAPHIC]
Sep
29
2017
![Should I Buy a Home Now? Or Wait Until Next Year? [INFOGRAPHIC]| Simplifying The Market](http://d39ah2zlibpm3g.cloudfront.net/wp-content/uploads/2017/09/28125015/20170929-Share-STM.jpg)
Some Highlights:
- The Cost of Waiting to Buy is defined as the additional funds it would take to buy a home if prices & interest rates were to increase over a period of time.
- Freddie Mac predicts interest rates to rise to 4.4% by next year.
- CoreLogic predicts home prices to appreciate by 5.0% over the next 12 months.
- If you are ready and willing to buy your dream home, find out if you are able to!
Posted in First Time Home Buyers, For Buyers, Infographics, Interest Rates, Millennials, Move-Up Buyers, Pricing
Lack of Existing Home Inventory Slows Sales Heading into Fall [INFOGRAPHIC]
Sep
22
2017

Some Highlights:
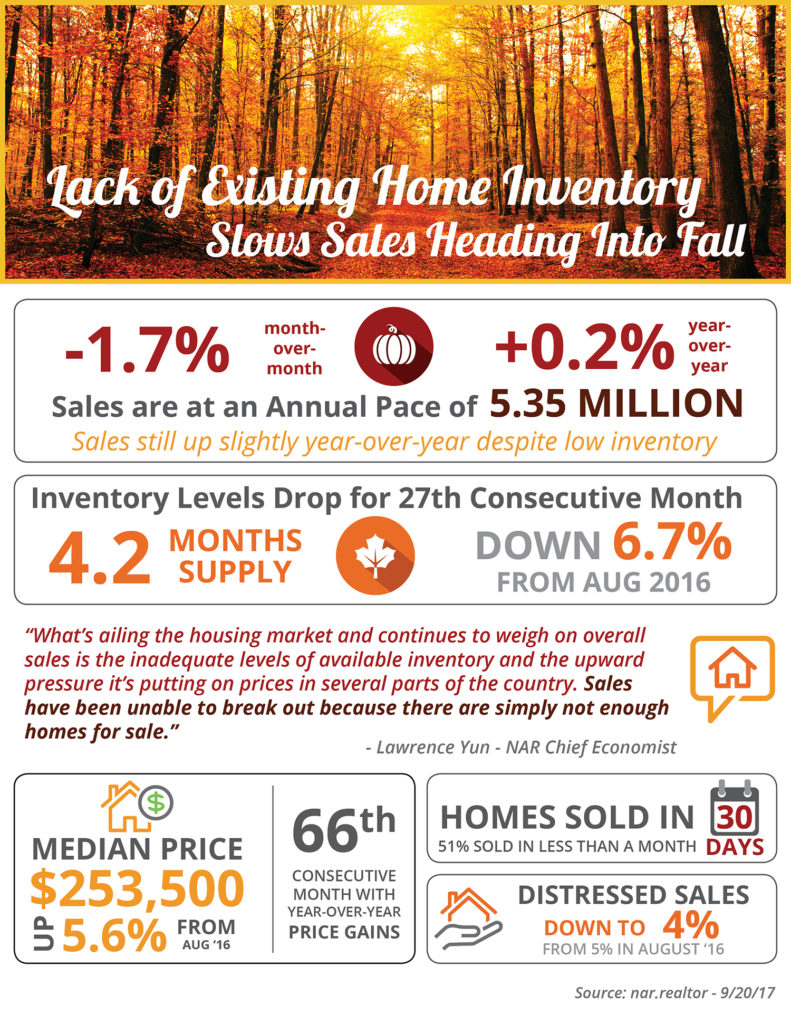
- The National Association of Realtors (NAR) recently released their latest Existing Home Sales Report.
- First-time homebuyers made up 31% of all sales in August.
- Homes are selling quickly with 51% of homes on the market for less than a month.
- A limited supply continues to drive up prices for the 66th consecutive month.
Posted in For Buyers, For Sellers, Infographics, Move-Up Buyers, Pricing
Top 5 Reasons Why Millennials Choose to Buy [INFOGRAPHIC]
Sep
15
2017

Some Highlights:
- “The majority of millennials said they consider owning a home more sensible than renting for both financial and lifestyle reasons — including control of living space, flexibility in future decisions, privacy and security, and living in a nice home.”
- The top reason millennials choose to buy is to have control over their living space, at 93%.
- Many millennials who rent a home or apartment prior to buying their own homes dream of the day that they will be able to paint the walls whatever color they’d like, or renovate an outdated part of their living space.
Posted in First Time Home Buyers, For Buyers, Infographics, Millennials
How Supply and Demand Impacts Real Estate Home Values [INFOGRAPHIC]
Sep
08
2017
![How Supply and Demand Impacts Real Estate Home Values [INFOGRAPHIC] | Simplifying The Market](http://d39ah2zlibpm3g.cloudfront.net/wp-content/uploads/2017/09/06153544/20170908-Share-STM.jpg)
Some Highlights:
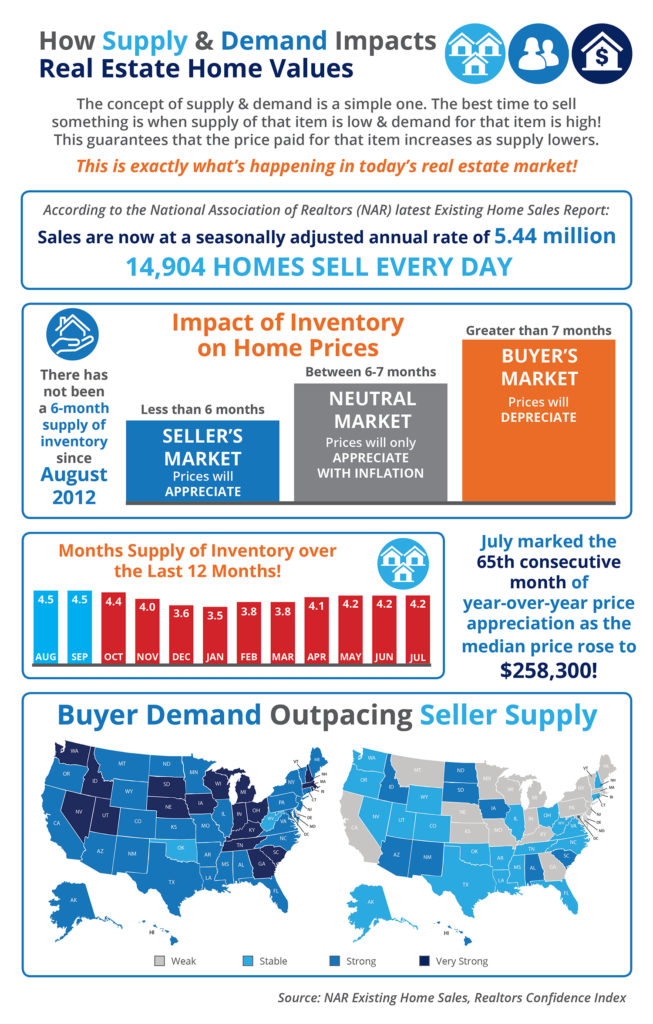
- The concept of supply & demand is a simple one. The best time to sell something is when the supply of that item is low & the demand for that item is high!
- Anything under a 6-month supply is a seller’s market!
- Nationally, there has not been a 6-months inventory supply since August 2012!
- Inventory levels differ depending on the area of the country and price range, so let’s get together to discuss the exact market conditions in our area.
Posted in For Buyers, For Sellers, Housing Market Updates, Infographics
Top 5 A+ Reasons to Hire a Real Estate Pro [INFOGRAPHIC]
Sep
01
2017

Some Highlights:
- Hiring a real estate professional to buy your dream home, or sell your current house, is one of the most ‘educated’ decisions you can make!
- A real estate professional has the experience needed to help you through the entire process.
- Make sure that you hire someone who knows current market conditions & can simply and effectively explain them to you and your family!
Posted in For Buyers, For Sellers, FSBOs, Infographics
Home Prices Up 6.64% Across the Country! [INFOGRAPHIC]
Aug
25
2017
![Home Prices Up 6.64% Across the Country! [INFOGRAPHIC] | Simplifying The Market](http://d39ah2zlibpm3g.cloudfront.net/wp-content/uploads/2017/08/24140034/20170825-Share-STM.jpg)
Some Highlights:
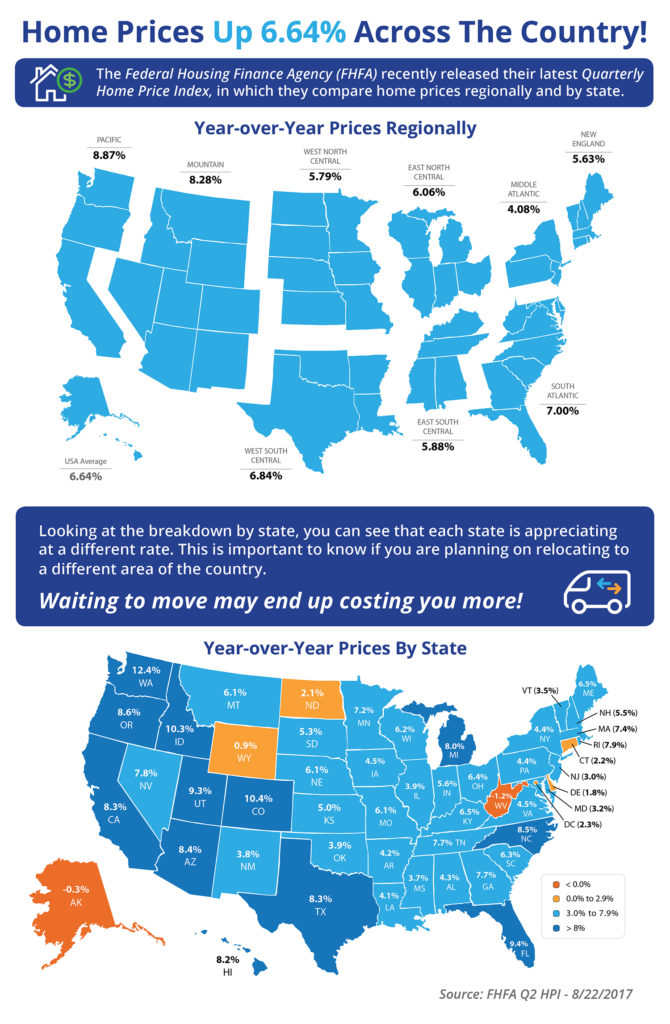
- The Federal Housing Finance Agency (FHFA) recently released their latest Quarterly Home Price Index report.
- In the report, home prices are compared both regionally and by state.
- Based on the latest numbers, if you plan on relocating to another state, waiting to move may end up costing you more!
- Alaska & West Virginia were the only states where home prices are lower than they were last year.
Posted in For Buyers, For Sellers, Infographics, Move-Up Buyers, Pricing
To Stage…or Not to Stage? That Is the Question! [INFOGRAPHIC]
Aug
18
2017
![To Stage...or Not to Stage? That Is the Question! [INFOGRAPHIC] | Simplifying The Market](http://d39ah2zlibpm3g.cloudfront.net/wp-content/uploads/2017/08/17121457/20180818-Share-STM.jpg)
Some Highlights:
- The National Association of Realtors surveyed their members & released the findings of their Annual Profile of Home Staging.
- 50% of staged homes saw a 1-10% increase in dollar value offers from buyers.
- 77% of buyer’s agents said staging made it easier for buyers to visualize the home as their own.
- The top rooms to stage to attract more buyers are the living room, master bedroom, kitchen, and dining room.
Posted in For Sellers, Infographics
What State Gives You the Most ‘Bang for Your Buck’? [INFOGRAPHIC]
Aug
11
2017
![What State Gives You the Most ‘Bang for Your Buck’? [INFOGRAPHIC] | Simplifying The Market](http://d39ah2zlibpm3g.cloudfront.net/wp-content/uploads/2017/08/04155449/STM-Share.jpg)
Some Highlights:
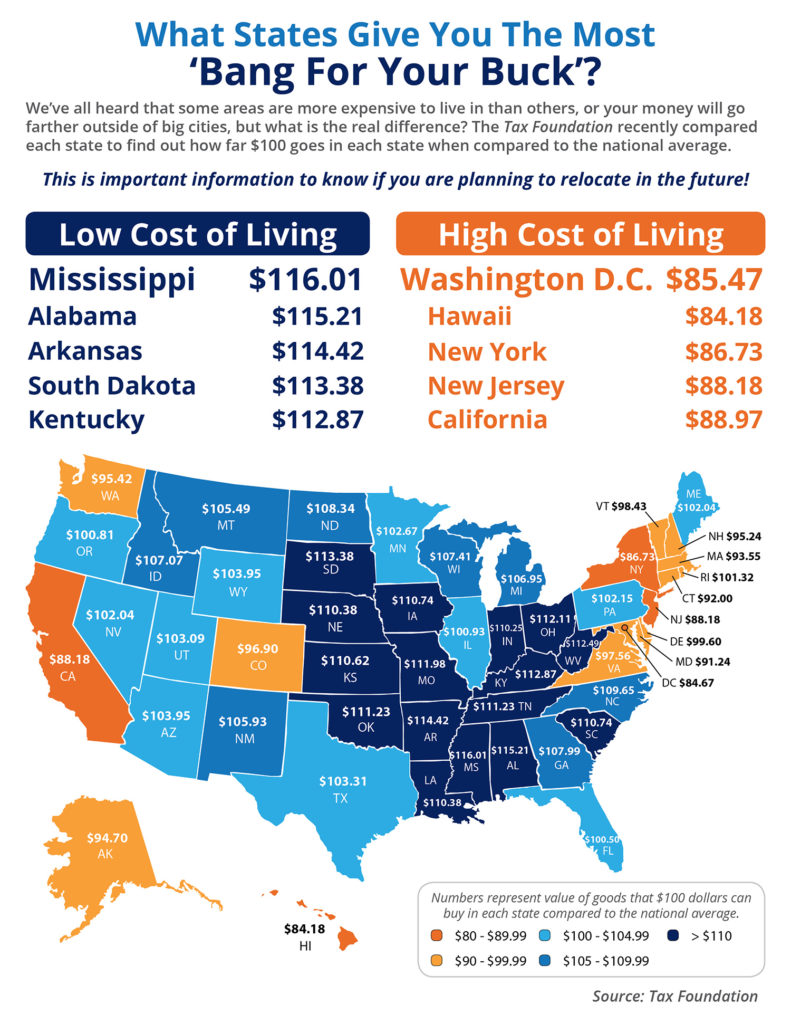
- Thinking of moving across the country? How far will your money take you?
- The majority of states in the Midwest and South offer a lower cost of living compared to Northeast and Western states.
- The ‘Biggest Bang for your Buck’ comes in Mississippi where, compared to the national average, you can actually purchase $116.01 worth of goods for $100.
- For more information regarding the methodology used to create the map, visit the Tax Foundation.
Posted in For Buyers, For Sellers, Infographics
20 Tips for Preparing Your House for Sale [INFOGRAPHIC]
Aug
04
2017
![20 Tips for Preparing Your House for Sale [INFOGRAPHIC] | Simplifying The Market](http://d39ah2zlibpm3g.cloudfront.net/wp-content/uploads/2017/07/17162328/20170804-Share-STM.jpg)
Some Highlights:
- When listing your house for sale your top goal will be to get the home sold for the best price possible!
- There are many small projects that you can do to ensure this happens!
- Your real estate agent will have a list of specific suggestions for getting your house ready for market and is a great resource for finding local contractors who can help!
Posted in For Sellers, Infographics
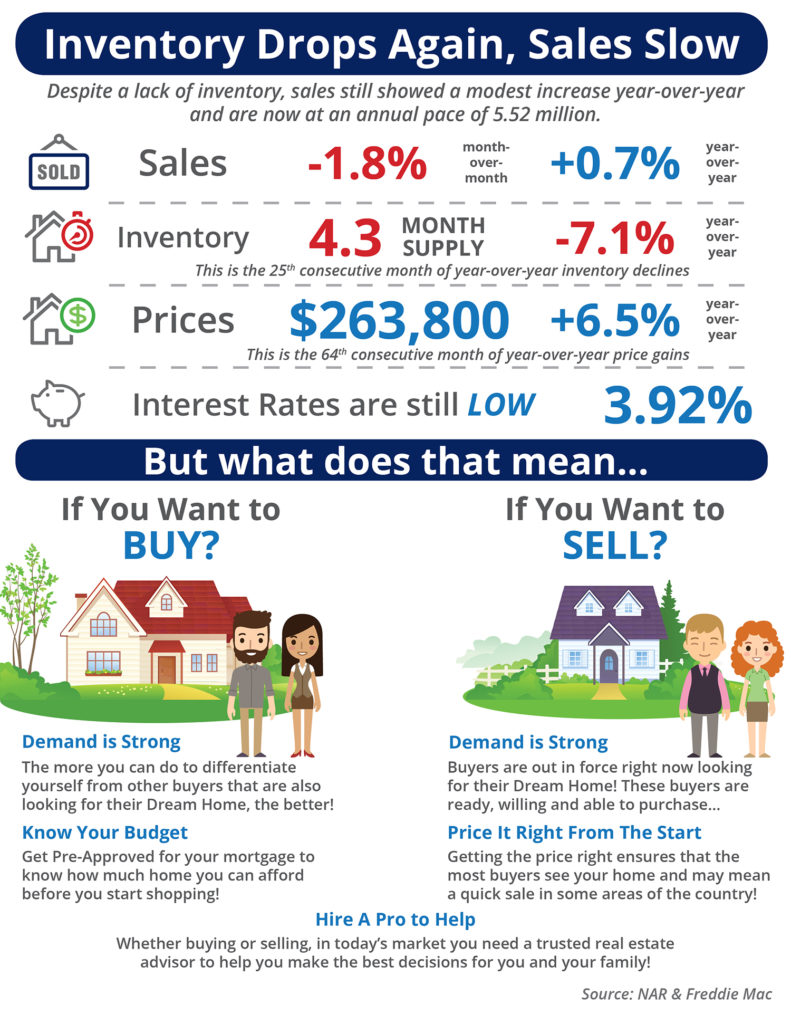
Inventory Drops Again, Sales Slow [INFOGRAPHIC]
Jul
28
2017
![Inventory Drops Again, Sales Slow [INFOGRAPHIC] | Simplifying The Market](http://d39ah2zlibpm3g.cloudfront.net/wp-content/uploads/2017/07/27114549/20170728-Share-STM.jpg)
Highlights:
- Existing Home Sales are now at an annual pace of 5.52 million.
- Inventory of existing homes for sale dropped to a 4.3-month supply, marking the 25th month in a row of declines.
- The median price of homes sold in June was $263,800. This is the 64th consecutive month of year-over-year price gains.
Posted in For Buyers, For Sellers, Infographics

